Rejoignez notre page de fans
- Vues:
- 14589
- Note:
- Publié:
- Mise à jour:
-
Besoin d'un robot ou d'un indicateur basé sur ce code ? Commandez-le sur Freelance Aller sur Freelance
This indicator is a modification of classical Awesome Oscillator indicator. It computes the smoothed difference of two exponential moving averages.
The indicator has 3 inputs: shortmean and longmean stand for the periods of two exponential moving averages (by default 30 and 60, respectively). The last input, meanAO, indicate the period of the smoothed moving average for the difference (in pips) between the shortmean-longmean EMA's.
The code has essentially three buffers:
- ExtFastBuffer is the exponential moving average with period shortmean;
- ExtSlowBuffer is the exponential moving average with period longmean;
- ExtAOBuffer defined as
ExtAOBuffer[i]=(ExtFastBuffer[i]-ExtSlowBuffer[i])/_Point/10;
Finally, using the "include <MovingAverages.mqh>", we compute the smoothed moving average of this last array (ExtAOBuffer) obtaning the indicator.
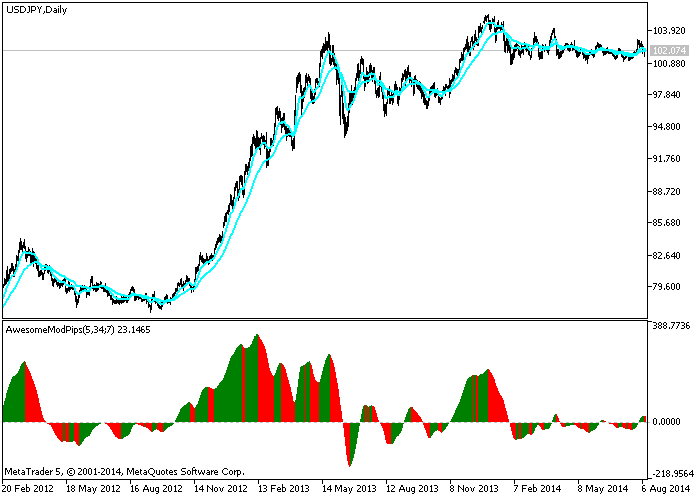
In the following image you can show this indicator in a daily chart of USDJPY with inputs 5 and 34 for the exponential means and 7 for the mean of the difference between them.

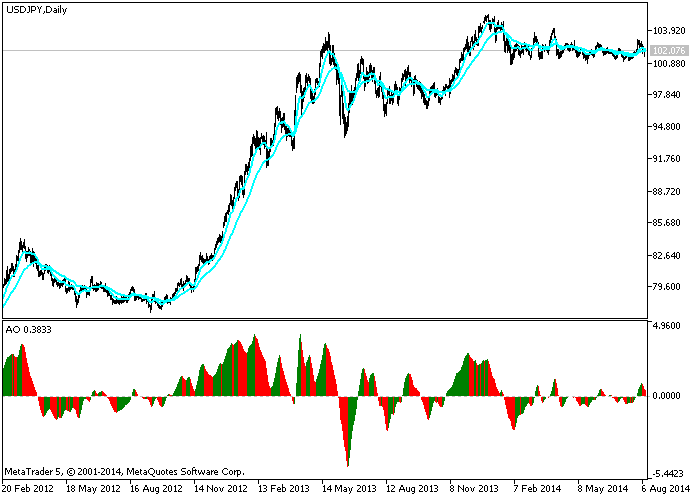
You can compare the indicator with the classical Awesome indicator which has as inputs for the exponential averages 5 and 34 in the following image.

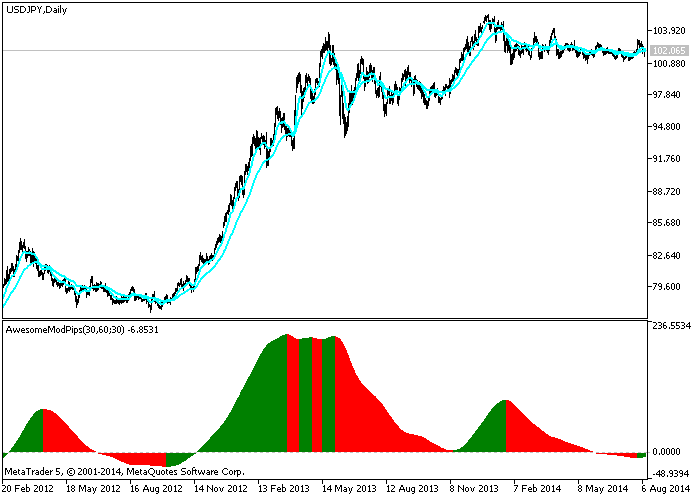
Here, you can show an image with the parameters by default (30-60-30):

 PipsToAverage
This indicator measures the (smoothed) distance in pips between the close and an exponential moving average.
 Rate_AOModPips
This indicator measures the rate of change of AwesomeModPips indicator.
 Linear Regression
The indicator uses the least squares method for the construction of the "most suitable" straight line through a series of points of price values.
 Color Linear Regression
Color version of the Linear Regression indicator.