London Breakout Indicator
- Indicadores
- Versión: 1.0
- Activaciones: 20
El indicador London Breakout es una herramienta de análisis técnico utilizada en el mercado de divisas para ayudar a los operadores a identificar posibles rupturas durante la apertura de la sesión de negociación de Londres. Este indicador está diseñado para ayudar a los operadores a aprovechar la volatilidad y el impulso que se producen durante este periodo de tiempo, lo que puede dar lugar a importantes movimientos de precios.
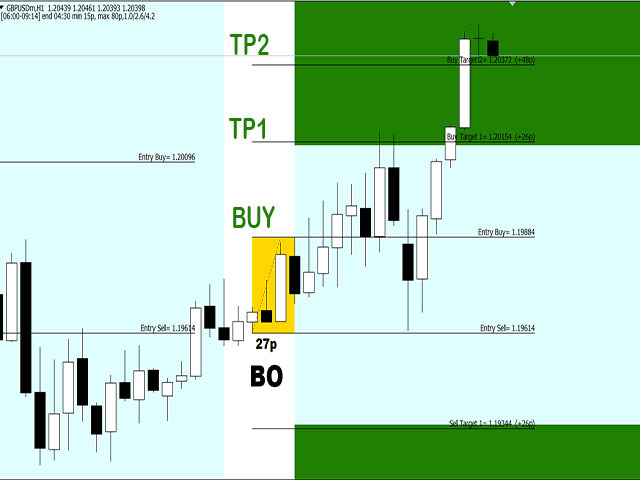
El indicador London Breakout funciona identificando el rango de movimiento de precios durante la sesión asiática que precede a la apertura de Londres y, a continuación, proyectando posibles niveles de ruptura basados en este rango. El indicador suele mostrar dos líneas horizontales que representan el máximo y el mínimo del rango de la sesión asiática, así como líneas adicionales que proyectan posibles niveles de ruptura basados en el rango.
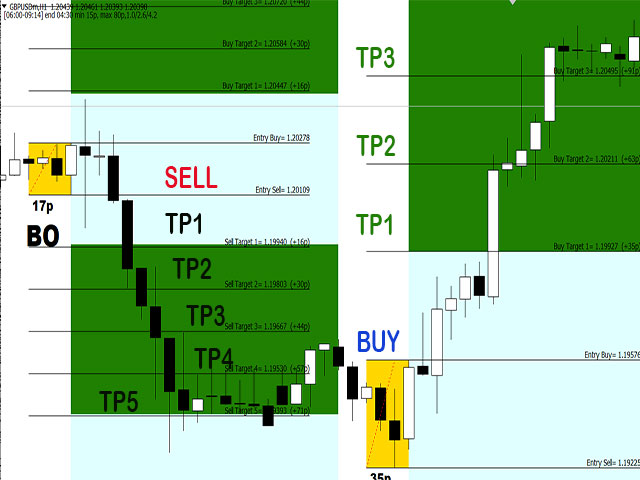
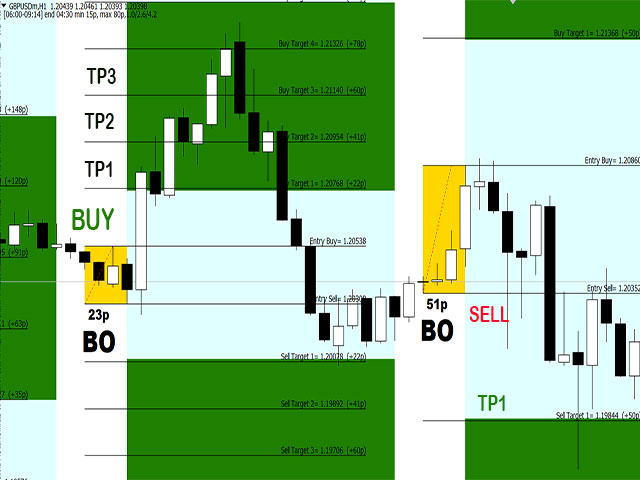
Los operadores pueden utilizar el indicador London Breakout de varias maneras. Por ejemplo, pueden utilizarlo para identificar los posibles puntos de entrada y salida de las operaciones, o para ayudarles a establecer los niveles de stop loss y take profit. Los operadores también pueden utilizar el indicador para ayudarles a identificar tendencias y patrones de precios que pueden informar sus decisiones de negociación.
Para utilizar el indicador London Breakout con eficacia, los operadores deben estar familiarizados con los conceptos de análisis técnico y tener una sólida comprensión del mercado de divisas. También deben estar al tanto de las noticias económicas y otros eventos del mercado que puedan afectar al mercado durante la sesión de negociación de Londres, ya que estos eventos pueden causar una volatilidad significativa y pueden afectar a la exactitud de las proyecciones del indicador.
En general, el indicador London Breakout es una herramienta útil para los operadores de divisas que buscan tomar ventaja de los movimientos de precios que se producen durante la apertura de la sesión de negociación de Londres. Al ayudar a los operadores a identificar posibles niveles de ruptura, el indicador puede ayudarles a tomar decisiones de negociación más informadas y aumentar sus posibilidades de éxito en el mercado de divisas.
Entradas :
- StartTime : hora de inicio de la ventana de establecimiento de precios
- EndTime: hora de finalización de la ventana de establecimiento de precios
- SessionEndTime: fin de la sesión diaria; mañana es otro día
- SessionColor: muestra los periodos de sesión con un color de fondo diferente
- NumDays: días atrás
- MinBoxSizeInPips: tamaño mínimo de la caja negociable; cuando la caja es más pequeña que eso, debería al menos reducir su tamaño de lote habitual si decide negociarla.
- MaxBoxSizeInPips: tamaño máximo de la caja negociable; no opere cuando la caja sea mayor que ese valor.
- LimitBoxToMaxSize: cuando es true, una caja mayor que MaxBoxSizeInPips será limitada a MaxBoxSizeInPips, y centrada en el valor EMA(box_time_range).
- StickBoxToLatestExtreme: (se aplica cuando "LimitBoxToMaxSize" es true) cuando es true, la caja se "pegará" al máximo o mínimo de la caja, lo que ocurra último; si no, se centrará en el valor EMA(box_time_range).
- StickBoxOusideSRlevels: cuando es true, usaremos el último PA más alto/más bajo como nivel S/R, y "pegaremos" la caja fuera de él.
- TP1Factor
- TP2Factor: a medio camino entre TP1Factor y TP3Factor;
- TP3Factor
- TP4Factor: ajustado a la mitad entre TP3Factor y TP5Factor
- TP5Factor: Los objetivos TP4 y TP5 son OPCIONALES: establezca TP5Factor=0 para permitir sólo hasta el objetivo TP3;
extern string TP2_help = "TP2 está a medio camino entre TP1 y TP3". - TP4_ayuda "TP4 está a medio camino entre TP3 y TP5".
- SLFactor
- LevelsResizeFactor
- BoxColorOK = Azul claro;
- BoxColorNOK = Rojo;
- BoxColorMAX = Naranja;
- LevelColor = Negro;
- FibLength = establecido en 14;
- showProfitZone = true o false
- ProfitColor = Verde claro;
- bjPrefix = "LB2-"; // todos los objetos dibujados por este indicador llevarán este prefijo