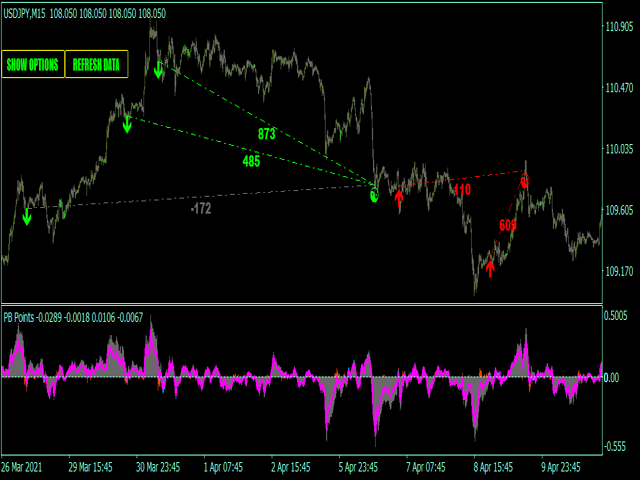
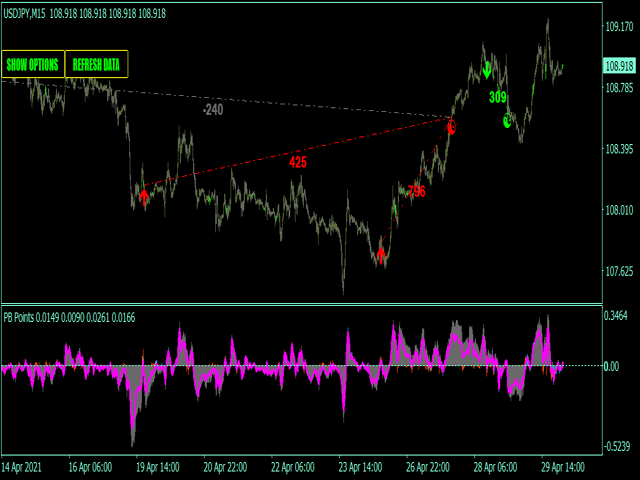
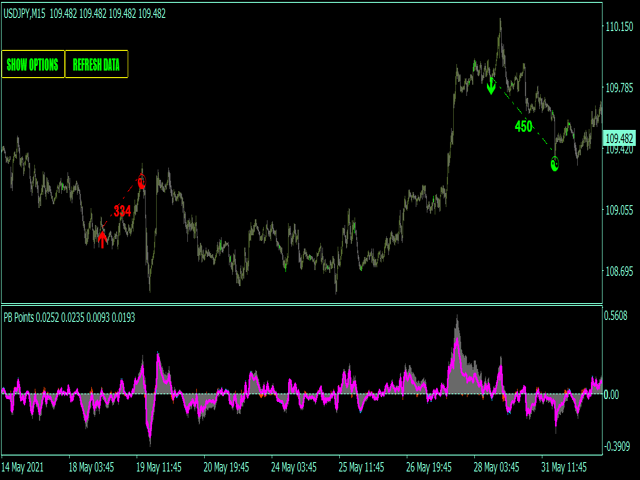
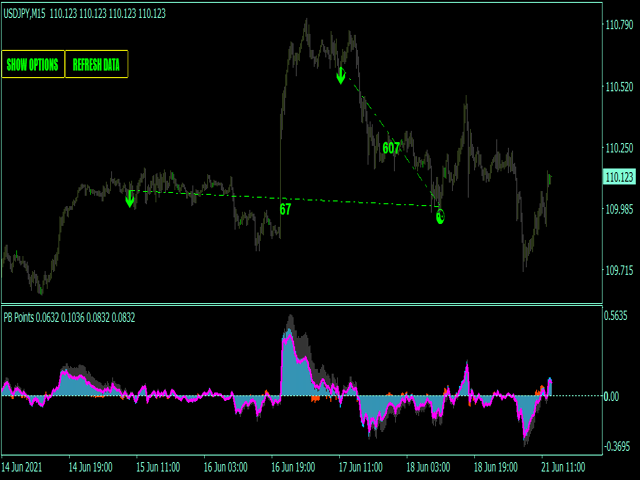
Pullback points indicator
- Indicadores
- Versión: 1.0
- Activaciones: 5

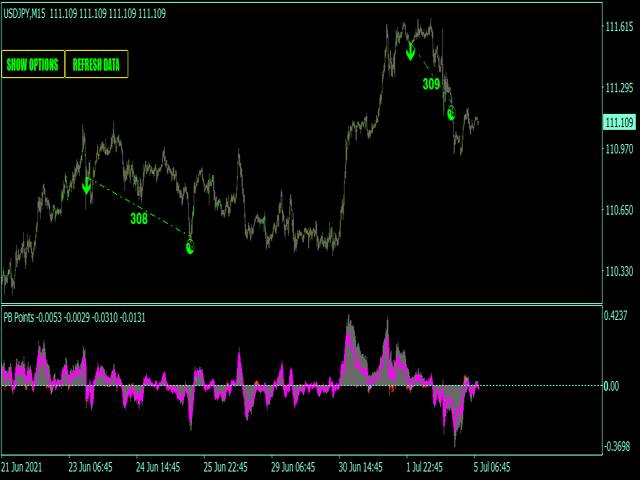
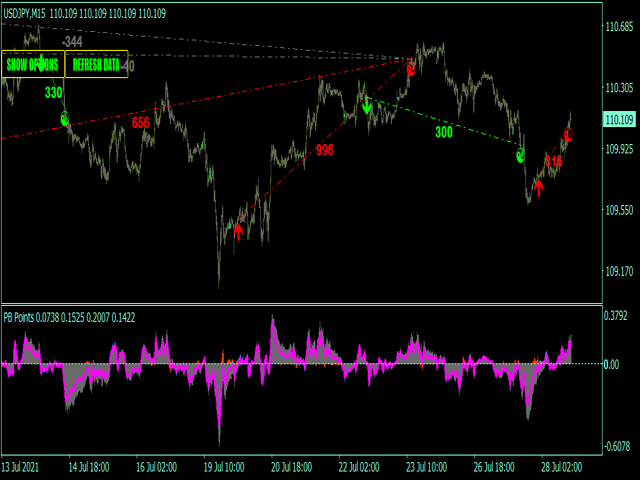
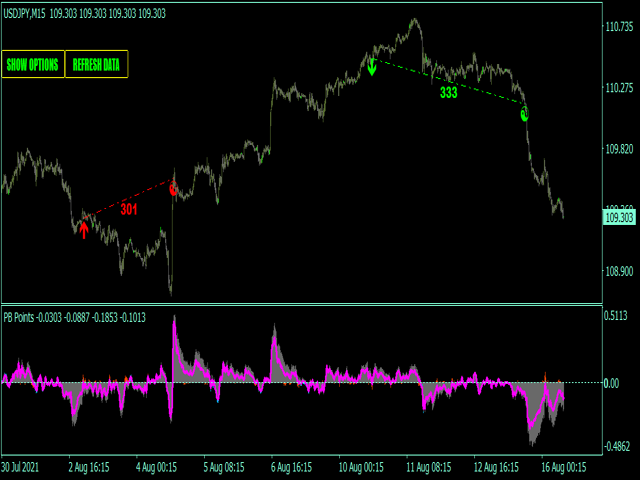
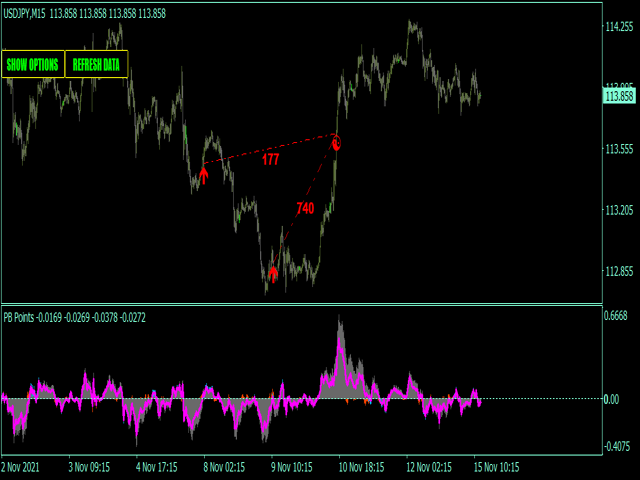
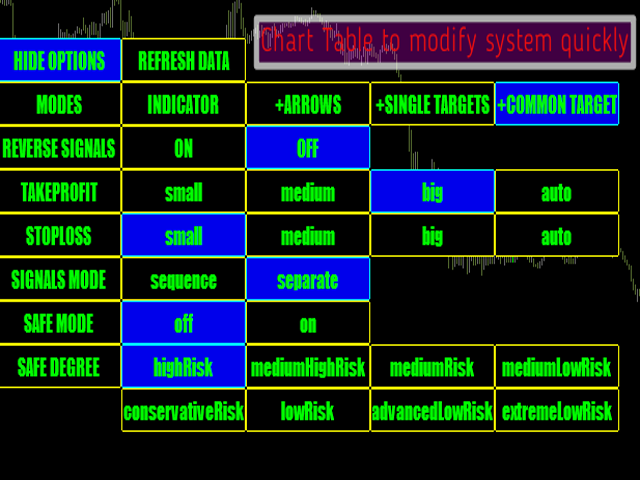
Indicador de puntos de retroceso - es el sistema de comercio manual, que muestra los precios más populares del mercado. El indicador mide la presión de las ondas alcistas/bajistas y busca precios "de consenso". Como regla general, estos puntos se cruzan hacia arriba y hacia abajo muy a menudo y el comercio abierto tiene varias posibilidades de ser cerrado en la zona positiva. Principalmente, estos puntos son una buena base para los tipos de estrategias de "beneficio común". Indicador también representa "beneficio común" scalping método de negociación por defecto.
Características principales del indicador
- Las señales no se repintan, tardan o desaparecen;
- Cada señal viene en la apertura de la nueva barra (el sistema utiliza sólo las señales confirmadas);
- El indicador tiene alertas, correo y notificaciones Push (permite operar fuera de la PC, desde el teléfono inteligente / aplicación móvil);
- Indicador tiene objetivos de ganancias / pérdidas;
Recomendaciones para el comercio
- EURUSD, EURJPY, GBPJPY, USDJPY, CADJPY;
- Mejores marcos temporales - M5-H1 timeframe;