Pullback points indicator
- インディケータ
- バージョン: 1.0
- アクティベーション: 5

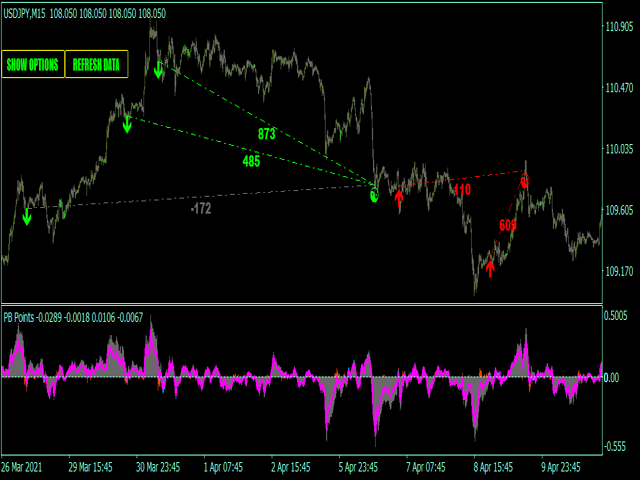
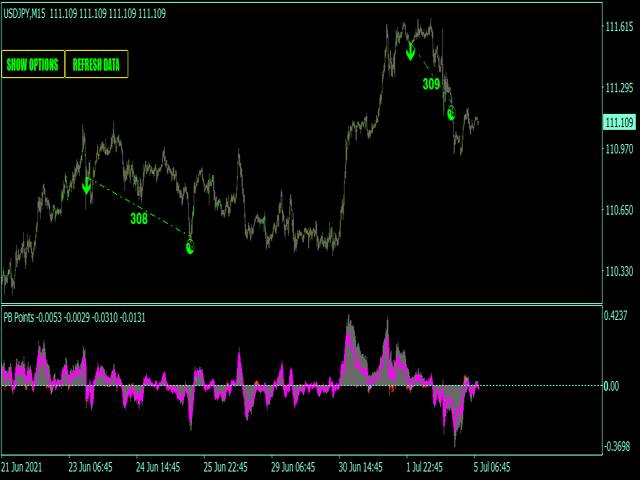
Pullback points indicator - is the manual trading system, that shows most popular market prices. Indicator measures bull/bear waves pressure and looks for "consensus" prices. As a rule these points are crossed up and down very often and opened trade has several chances to be closed in positive zone. Mainly, such points is the good base for "common profit" types of strategies. Indicator also represents "common profit" scalping method of trading as default one.
Main Indicator's Features
- Signals are not repaint, late or disappear;
- Every signal comes at the open of new bar(system uses only confirmed signals);
- Indicator has Alerts, Mail and Push notifications(allow to trade out of PC, from smartphone/mobile app);
- Indicator has profit/loss targets;
Recommendations for trading
- EURUSD, EURJPY, GBPJPY, USDJPY, CADJPY;
- Best timeframes - M5-H1 timeframe;