Trend Reversal Index
- Indicadores
- Versión: 1.10
- Actualizado: 22 septiembre 2022
- Activaciones: 5

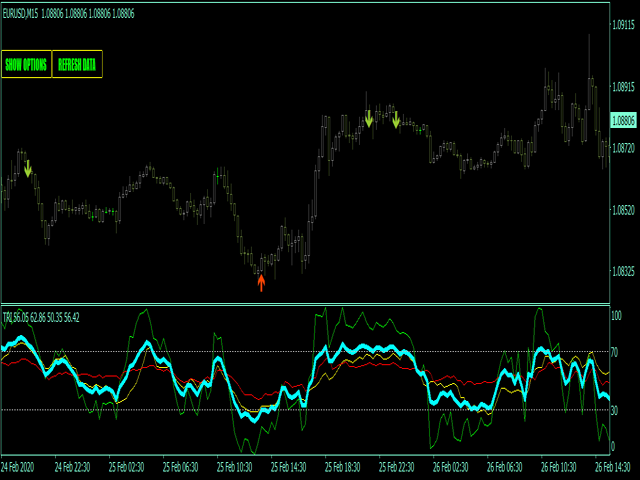
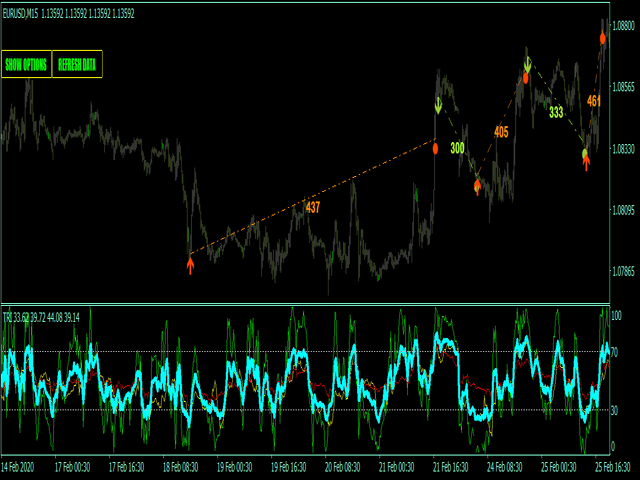
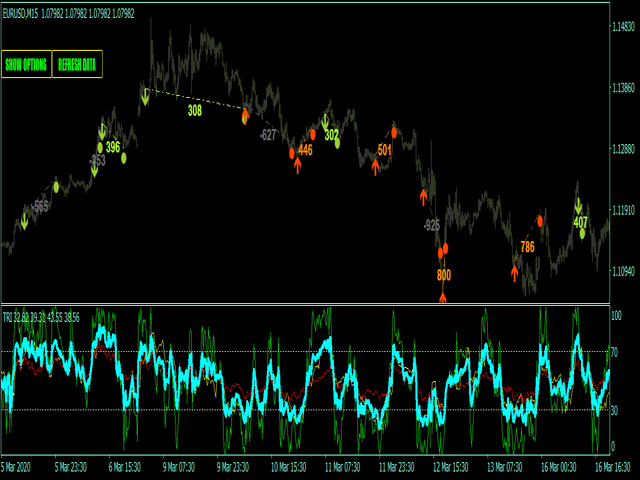
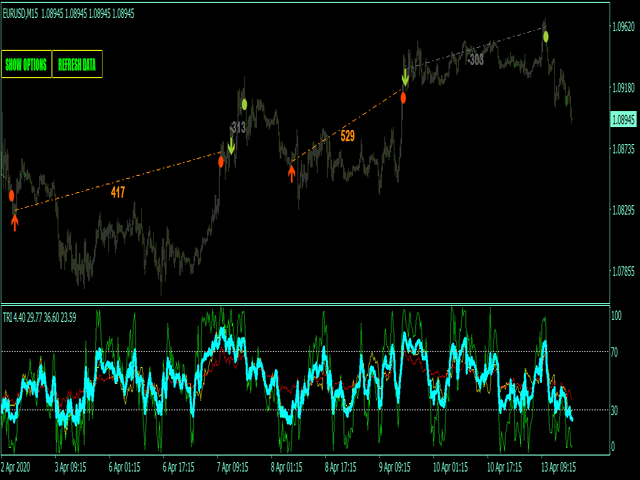
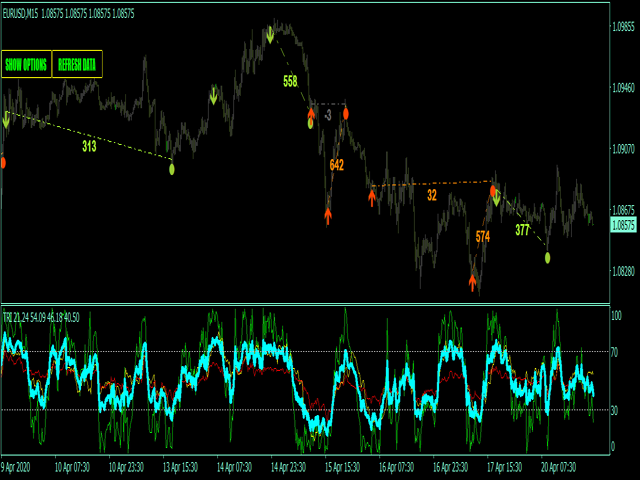
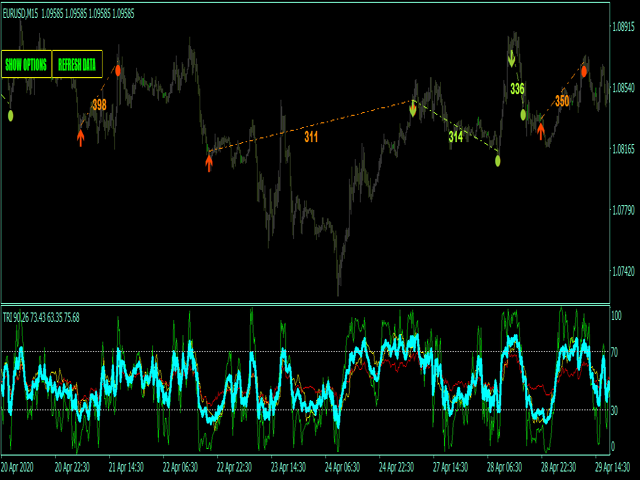
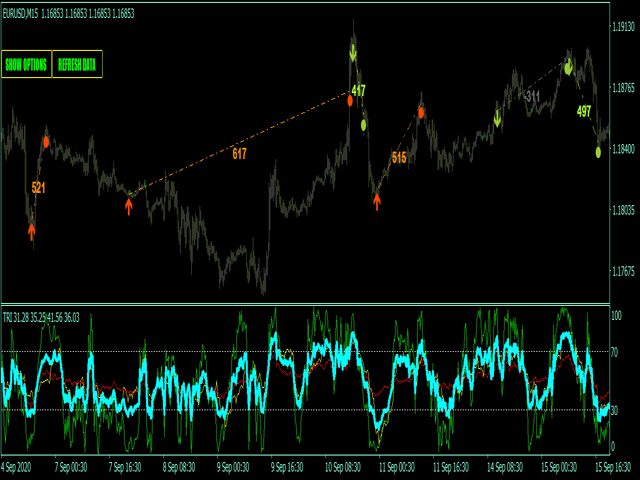
Trend reversal index - es el sistema de trading manual que trabaja con niveles de sobrecompra, sobreventa y patrones de inversión.
La flecha de venta se traza cuando el indicador está por encima del nivel de sobrecompra y aquí se forma el patrón de inversión, todos los puntos del patrón
todos los puntos del patrón se encuentran por encima del nivel de sobrecompra. Al contrario que la flecha de compra: el indicador está por debajo del nivel de sobreventa y aquí se forma un patrón de inversión, todos los puntos del patrón se sitúan por debajo del nivel de sobrecompra.
Características principales del indicador
- Las señales no se repintan, se retrasan o desaparecen;
- Cada señal viene en la apertura de la nueva barra (el sistema utiliza sólo las señales confirmadas);
- Indicador tiene alertas, correo y notificaciones Push (permite el comercio fuera de la PC, desde el teléfono inteligente / aplicación móvil);
- Indicador tiene objetivos de ganancias / pérdidas;
Recomendaciones para el comercio
- Mercados populares de volatilidad con spread bajo;
- Mejores marcos de tiempo - marco de tiempo intradía;


This is one of the best indicators I have purchased on MQL5 for scalping.
Accurate and very fast!
Update 12 February 2023
I confirm!
The best indicators that i have
Compliments Ekaterina