Ticks ATR
- Indicadores
- Versión: 1.12
- Actualizado: 17 noviembre 2021
- Activaciones: 5

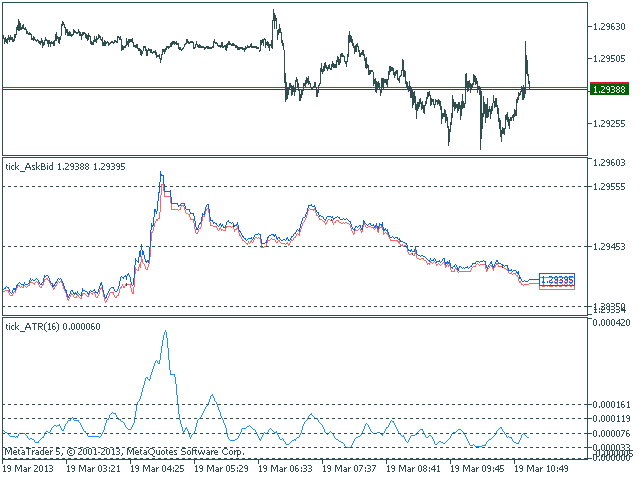
El indicador Average True Range (ATR) dibujado utilizando un gráfico de ticks.
Después de lanzarlo, espere a que aparezcan suficientes ticks.
Parámetros:
- Período ATR - número de períodos individuales utilizados para el cálculo del indicador.
- El número de ticks para identificar Bar - número de ticks individuales que forman OHLC.
- Price levels count - número de niveles de precios mostrados (no se muestran niveles si se establece en 0 o un valor inferior).
- Barra calculada - número de barras para el cálculo del indicador.