MR Range Breakouts 5
- Indicadores
- Versión: 4.0
- Actualizado: 5 marzo 2026
- Activaciones: 20
Para que se haga una idea, presentaremos brevemente los procesos que tienen lugar en el rango:
1. Cuando tenemos dos extremos y el precio ha testeado al menos el 75% de la distancia entre ellos en forma de movimiento correctivo, decimos que se ha establecido un "Equilibrio" entre compradores y vendedores. Normalmente, las intenciones de lograr un "Equilibrio" de los precios sólo las conocen los "Grandes" actores de los mercados. Si el precio continúa o realiza un nuevo impulso, renueva uno de los extremos, y no vuelve de nuevo a ellos en forma de corrección, decimos que se ha roto el "Equilibrio" y que ahora tenemos un "Desequilibrio".
2. 2. Si, tras alcanzar un "Equilibrio" entre compradores y vendedores, el precio continúa moviéndose entre dos precios extremos, decimos que se ha desarrollado un "Rango" entre los dos precios extremos. Aquí, junto con los "Grandes" operadores del mercado, también entran en posiciones los operadores "Profesionales".
3. Cuando los precios permanecen en el "Rango" durante más tiempo, este "Rango" también es visto (percibido) por los participantes "No profesionales" del mercado. Normalmente sus stop-losses se colocan por encima o por debajo de los límites del "Rango". Aquí es donde decimos que tenemos un " Rango Abierto" porque todos los participantes del mercado pueden entrar activamente en posiciones y negociar la distancia entre los dos extremos que definen los límites superior e inferior del "Rango".
4. Cuando se acumulan suficientes participantes en el "Rango" con sus stop-losses, algunos de los "Grandes" intentan cerrar el "Rango" de precios saliendo de él a expensas de estos stop-losses. Si lo consiguen y se produce una "corrección" más allá del "Rango", decimos que el "Rango abierto" está bloqueado por estos jugadores "Grandes" y tenemos un "Rango de Compradores" o un "Rango de Vendedores".
5. Si otra parte de los "Grandes" jugadores deciden que no les gusta y devuelven el precio al "Rango" y prueban un mínimo del 75% de la distancia entre los dos extremos que definen los límites del "Rango", entonces decimos que tenemos una "Extensión" de los límites del "Rango Abierto". En este caso, se actualiza la distancia entre los límites superior e inferior del "Open Range", y se determina una nueva distancia de prueba del rango del 75%.
6. Si estos "Grandes" no consiguen que el precio vuelva al menos al 75% después de salir del rango, entonces decimos que hay una lucha por el dominio entre diferentes grupos de "Grandes". Esto suele ocurrir en los límites superior o inferior del "Rango Abierto" y entre las barreras bajistas o alcistas de las "órdenes límite". Entonces decimos que tenemos una "Expansión " de vendedores o una "Expansión" de compradores.
7. Según nuestra experiencia con el indicador, los mejores lugares para entrar en una posición son las zonas de barrera de las "órdenes límite " en la dirección de la tendencia. Por ejemplo, si tenemos una tendencia bajista, buscamos una entrada de venta en el área de barrera de "órdenes límite" de los vendedores, y en consecuencia, si tenemos una tendencia alcista, buscamos una entrada de compra en el área de barrera de "órdenes límite" de los compradores. Por supuesto, todas nuestras decisiones deben ser confirmadas por otros indicadores en estas zonas.
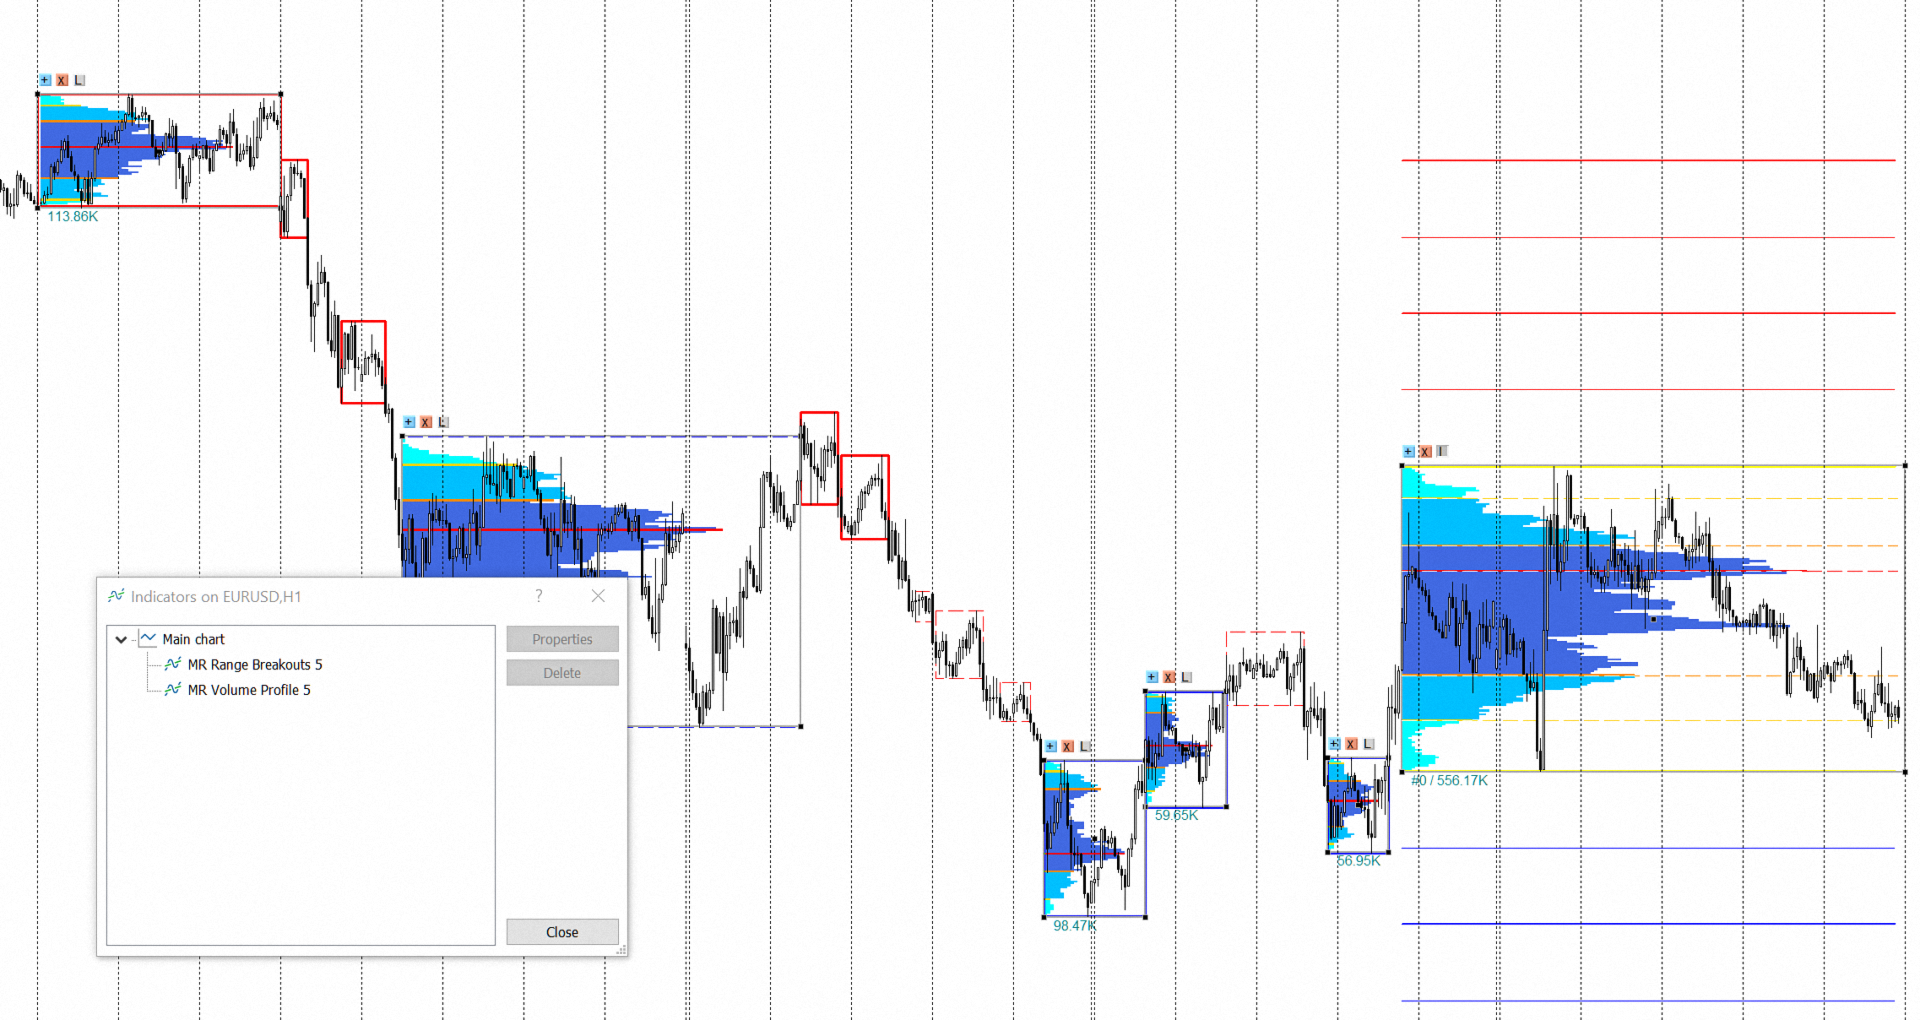
Qué muestra el indicador:
- Los rectángulos "rojos" muestran "Rangos de vendedores", donde los compradores permanecen en un "Rango bloqueado", y los vendedores ganan. Si coloca un perfil de volumen en un "Rango de vendedores", en la zona por debajo del volumen "POC", hay compradores en un "Rango bloqueado".
- Los rectángulos "azules" muestran "Rangos de Compradores", donde los vendedores permanecen en un "Rango Bloqueado", y los compradores ganan. Si coloca un perfil de volumen en un "Rango de Compradores", en el área por encima del volumen "POC" hay vendedores en un "Rango Bloqueado".
- Los rectángulos "discontinuos" muestran "Rangos" cerrados, es decir, los lugares en los que el precio absorbió los volúmenes de los rangos.
- "Las líneas amarillas indican los límites superior e inferior de la " horquilla abierta" (aún no se ha determinado si se trata de una horquilla de compradores o de vendedores). El "Open Range" es un rango nuevo y aún no finalizado. En ella se reclutan posiciones para los "Grandes", hay una lucha por la iniciativa entre los "Grandes" y se utilizan diversas herramientas en el enfrentamiento entre ellos. Desgraciadamente, este es también el lugar donde los participantes "no profesionales" del mercado pierden su dinero porque no entienden los procesos que tienen lugar en la gama.
- "Rectángulo azul (línea de puntos)" indica el comienzo de la iniciativa de "Expansión" de los compradores. Muestra la lucha entre los "Grandes" del mercado, la posible ampliación del límite de la "Gama Abierta" o la posible formación de una nueva "Gama Abierta".
- El rectángulo "Rojo (línea de puntos)" indica el comienzo de la iniciativa de "Expansión" de los vendedores. Muestra la lucha entre los "Grandes" del mercado, la posible ampliación del límite de la "Zona Abierta" o la posible formación de una nueva "Zona Abierta".
- Las líneas "rojas" por encima del "Open Range" indican posibles zonas de barreras de "órdenes límite" de los vendedores.
- Las líneas "azules" por debajo del "Open Range" indican posibles zonas de barreras de "órdenes limitadas" de compradores.
"Barreras de "órdenes límite" son estructuras diseñadas para restringir el movimiento de los precios en cualquier dirección mediante la colocación constante de órdenes límite contra el movimiento. Suelen observarse por encima y por debajo de la acumulación (rango, equilibrio). Las barreras de "órdenes límite" son muy similares en funcionalidad a las órdenes Iceberg, que se pueden seguir en otras plataformas de negociación. En lugar de que el precio atraviese un nivel, el volumen de órdenes limitadas en ese nivel de precios se "renueva" una y otra vez. La cinta "Time & Sales" muestra una ráfaga de operaciones agresivas, pero el precio se mantiene en su sitio. Esta es una señal de fuerte interés pasivo. El precio no se moverá hasta que se ejecute o cancele todo el volumen oculto. Para el mercado, esto representa una poderosa barrera. A menudo, después de esto, el precio da un fuerte impulso, ya que la resistencia ha desaparecido."
- En combinación con el indicador "MR Reversal Patterns 5", puede ver cómo se distribuyen los compradores y los vendedores en el "Rango". Dado que todo operador espera la confirmación de que su entrada en el mercado es correcta, la aparición de "Patrones de Reversión" en el "Rango" forma la acumulación de posiciones abiertas en un lugar que definimos como "Punto de Control" en el Perfil de Volumen del Rango ". Durante el movimiento del precio en una tendencia, se puede ver cómo se forman "Balances" según la "Teoría del Mercado de Subastas".
- En combinación con el indicador "MR Volumen POC Niveles 5", puede ver dónde quedan volúmenes importantes tras la salida de los "Saldos" y "Rangos". Además, puede ver cómo se absorben los volúmenes en el "Rango" y acumular posiciones de compradores y vendedores.
- En combinación con el indicador "Perfil de Volumen MR 5", puede ver dónde se encuentran los lugares con mayor concentración de posiciones abiertas. En el "Rango de Vendedores", los compradores permanecen en el "Rango Bloqueado"-en la zona por debajo del volumen "POC", mientras que en el "Rango de Compradores", los vendedores permanecen en el "Rango Bloqueado"-en la zona por encima del volumen "POC".
- En combinación con el indicador "Volúmenes y Sentimientos 5", puede ver los "Sentimientos" dentro del rango. Cuando también tenemos una "Expansión" de los vendedores o de los compradores, se puede ver el desequilibrio de todos los participantes en el rango en relación con los de la "Expansión".
- En combinación con el indicador "Pullbacks on Trend 5", se pueden rastrear los lugares donde se acumulan los volúmenes en los "Saldos" y "Rangos" a lo largo de la tendencia. A continuación, los volúmenes de estos lugares se absorben en los movimientos de "Corrección".
Nota:
Puede haber ligeras diferencias entre las cifras que se dibujan en el gráfico del marco temporal que seleccionó en la configuración del indicador y las cifras que se dibujan en el gráfico de los marcos temporales más pequeños. Esto está relacionado con la descomposición de la barra del marco temporal seleccionado en los marcos temporales más pequeños. La barra del marco temporal seleccionado tiene una estructura diferente a la de los marcos temporales más pequeños. Esto no es un error. Esta es la opción que hemos adoptado para determinar correctamente las entradas y salidas de los rangos.
Si le ha gustado el indicador, ¡apoye nuestro trabajo dándole 5 estrellas!
Para MetaTrader 4 https://www.mql5.com/en/market/product/63855
Configuración del indicador:
Mostrar Multi-Time Frame de: - Multi-marco de tiempo en el que calcular el indicador. Por defecto, el indicador trabaja con datos del marco temporal H4.
Historial de barras para el cálculo: - Número de barras sobre las que trabaja el indicador a partir del marco temporal múltiple H4.
Sección Configuración de estilos visuales de negociación
Estilo 1: Borrar "Rangos" inactivos - Muestra o borra los "Rangos" cerrados por el precio y mostrados con una línea discontinua.
Estilo 2: Mostrar sólo " Rango abierto" - Muestra sólo el "Rango abierto" cuando se selecciona esta opción.
Estilo 3: Mostrar "Proporciones internas" - Muestra u oculta las "Proporciones internas" en el "Rango abierto".
Estilo4: Mostrar barreras de "órdenes limitadas" - Muestra u oculta las barreras de "órdenes limitadas".
Sección Ajustes de alerta para"R angos "
Alerta cuando se cierra un "Rango": - Muestra una alerta cuando un "Rango" se cierra por el movimiento del precio y se muestra con una línea discontinua.
Sección Ajustes para "Rangos"
Ancho de línea para "Rangos": - Puede seleccionar el ancho de línea para todos los Rangos no cerrados.
Color para "Rango de Vendedores": - Puede seleccionar un color para "Rango de vendedores".
Color para "Rango de compradores": - Puede seleccionar un color para "Rango de Compradores".
Color para "Rango Abierto": - Puede seleccionar un color para "Rango Abierto".
Porcentaje de confirmación de "Rango Abierto": - Puede elegir otro ajuste para cumplir el criterio de formación de "Rango". Por defecto, fijamos la distancia de prueba entre dos extremos igual a 75%. Otros valores aceptables son hasta el 50%.
Sección Ajustes para "Órdenes Límite"(LO ) Barreras
Ancho de líneapara (LO) "Barreras" 1 y 3: - Puede seleccionar el ancho de línea para "órdenes límite" Barreras 1 y 3. Según nuestras investigaciones, estas líneas son menos importantes para contener el movimiento del precio.
Anchura de líneapara (LO) " Barreras" 2 y 4: - Puede seleccionar la anchura de línea para las "órdenes limitadas" Barreras 2 y 4. De acuerdo a nuestra investigación, estas líneas son más importantes para contener el movimiento del precio.
Color para (LO) "Barreras "de Vendedores: - Puede seleccionar un color para "ordenes límite" Barreras de Vendedores.
Color para (LO) "Barreras" de Compradores: - Puede seleccionar un color para "ordenes límite" Barreras de Compradores.
Ajustes de sección para "Expansión"
Estilo de dibujo de línea para "Expansión ": - Puede seleccionar el estilo de línea para "Expansión".
Ancho de línea para "Expansión": - Puede seleccionar el ancho de línea para "Expansión".
Colorpara "Expansión" de Compradores: - Puede seleccionar un color para "Expansión" de Compradores.
Color para "Expansión" de Vendedores: - Puede seleccionar un color para "Expansión" de Vendedores.


Masters of Risk indicators (all 4 in the series) is a serious product for serious traders. MR Reversals are not a quick fix; however, I believe the trading style will work well for any trader willing to put in the work to learn the process and theory behind the indicators and overall trading strategy. More importantly, the developers of the MR indicators stand by their product. Svetoslav has been helping me learn the MR trading strategy - which goes way above and beyond the indicators. We have exchanged nearly 50 emails over the past 30-60 days. I have purchased 25+ indicators to help me get a better handle on institutional-level trading volumes and price action, I believe the MR indicator series is the only product that has put all of the pieces together in one system. As a trader you must still be committed to learning and applying yourself further every day, no tool/indicator will do your job for you. If you want long-term success as a trader - in almost any market - I believe the MR strategy can fill the gaps and provide the solutions for continued success. THANK YOU SVETOSLAV!!