Volume Magic MT5
- Indicadores
- Versão: 11.180
- Ativações: 5

Description
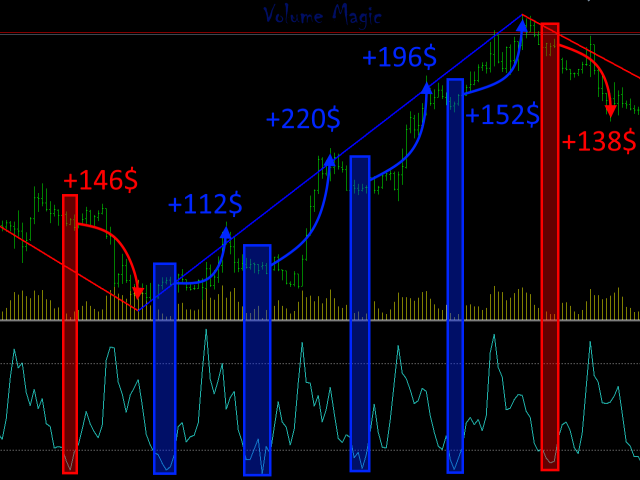
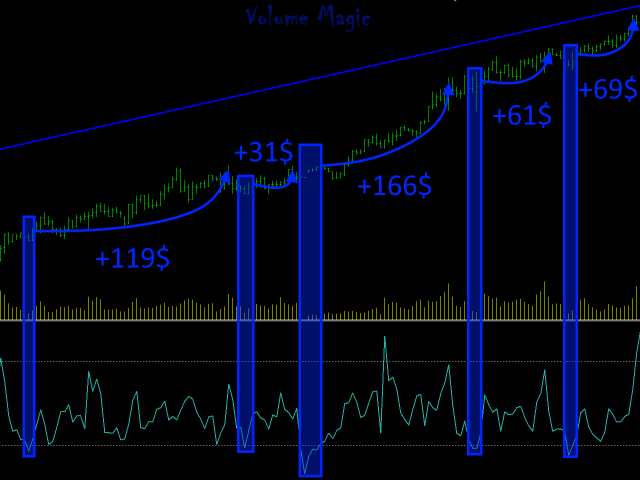
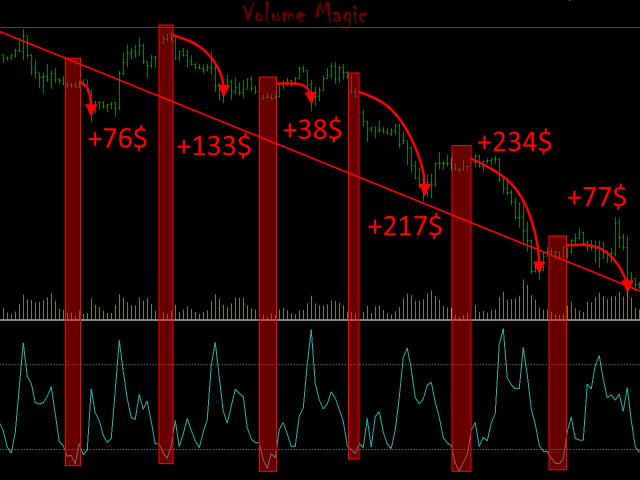
Volume Magic is an indicator that shows the value of the relative volume in conjunction with the direction of the current trend. The ratio of the current volume relative to the average volume for a certain period is displayed in the lower window as an oscillator. The direction of the current trend is displayed as two-color trend lines.
How to use?
First, use two-color trend lines to determine the direction of the current trend. Then look for areas of low volume and open positions in the direction of the trend.
Parameters
===== _INDICATOR_SETTINGS_ ===== - indicator settings
Maximum History Bars - maximum number of history bars for calculating the indicator.
Volume Period - relative volume period.
Trend Fast Moving Period - period of the fast moving average for trend determination.
Trend Slow Moving Period - period of the slow moving average for trend determination.
Movings Difference - minimum difference between moving averages (for trend determination).
===== _GRAPHICS_SETTINGS_ ===== - graphics settings
Up-Trend Lines Color - color of up-trend lines.
Down-Trend Lines Color - color of down-trend lines.
Trend Lines Width - width of trend lines.