Breakout Trend Lines
- Indicadores
-
Alexander Nikolaev
 I develop Expert Advisors, program in MQL4 and MQL5. I've been programming for a long time, I know C ++ and other languages.
Recommended advisors: - Versión: 1.1
- Actualizado: 14 noviembre 2020
- Activaciones: 5
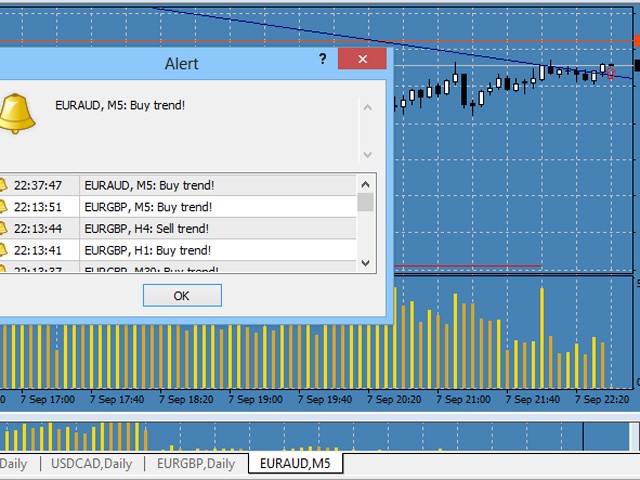
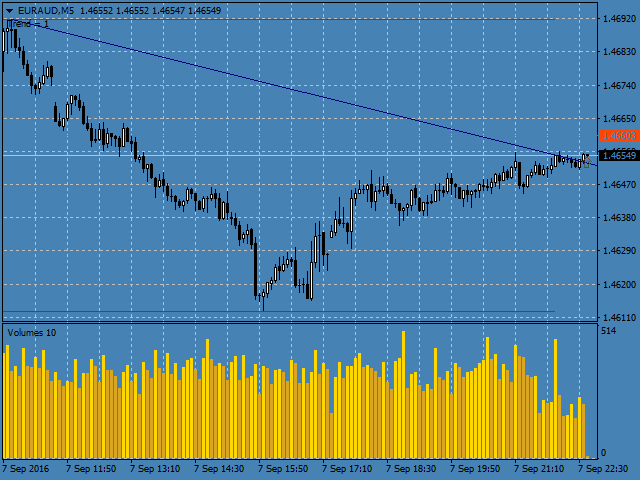
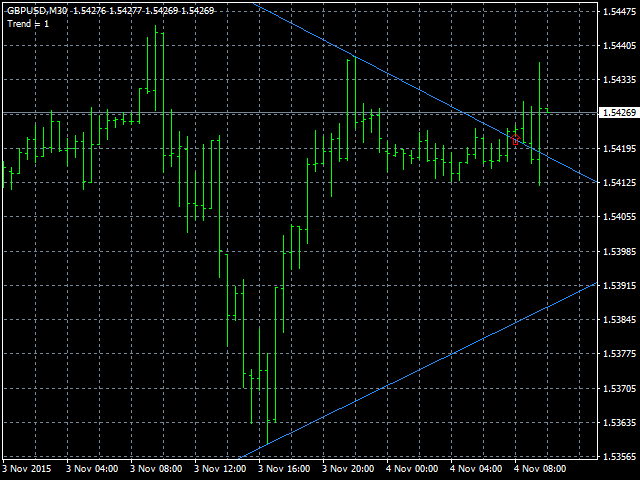
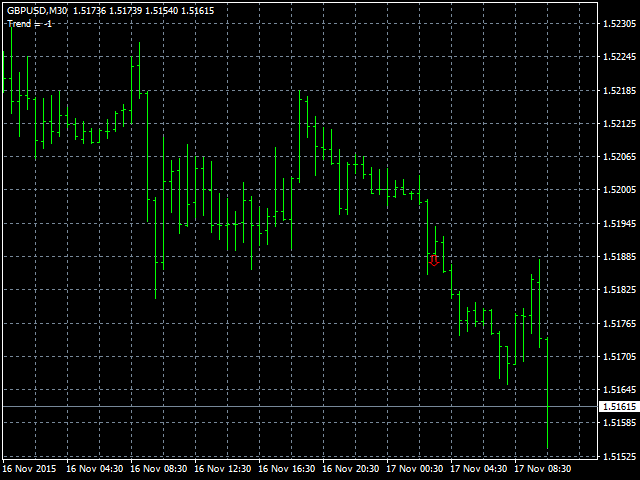
El indicador traza líneas basadas en los máximos y mínimos de los precios, así como líneas de tendencia oblicuas. La ruptura a través de la línea de tendencia, Máximo o Mínimo suele indicar un cambio de tendencia (o continuación). Una vez que el precio se mueve a través de una línea, y la vela se cierra, el indicador dibuja una flecha apropiada (también, puede activar alertas). Este indicador es fácil de usar, pero sin embargo, hay muchas estrategias de negociación, que se basan en una ruptura de las líneas de tendencia. El número de velas usadas para determinar las líneas de tendencia, así como los máximos y mínimos del rango de operación pueden ser ajustados.
Parámetros
- TradingRange - número de barras del rango de negociación utilizado para definir máximos y mínimos;
- Distancia - distancia mínima de un Máximo (o Mínimo) a otro cuando se construyen líneas de tendencia;
- Shift - desplazamiento relativo al rango de negociación para determinar la ruptura;
- EnableAlert - activar/desactivar alertas (true - activado);
- EnablePushNotifications - activar el envío de notificaciones a un smartphone;
- AddingTextToMessages - añadir texto a los mensajes;
- TrendLinesColor - color de las líneas de tendencia.

works like it says it does if your trading breakouts its a good tool