MA bounce LITE arrows
- Indicadores
-
Tomas Kremen
 Hello everyone, my name is Tomas, and I'm from little country in central Europe - Slovakia.
 - Versión: 1.3
- Actualizado: 11 abril 2021
- Activaciones: 5
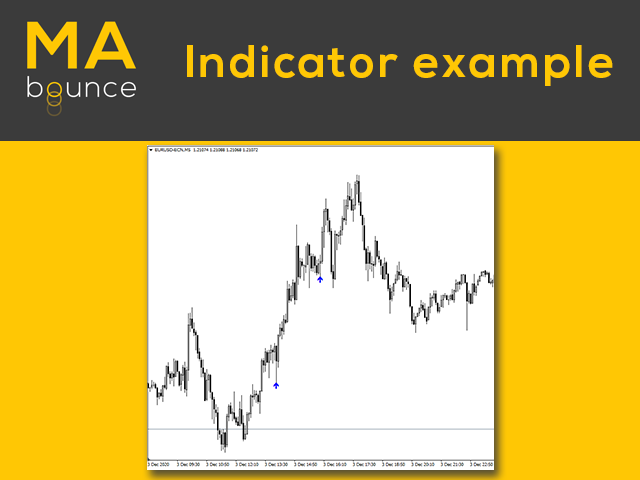
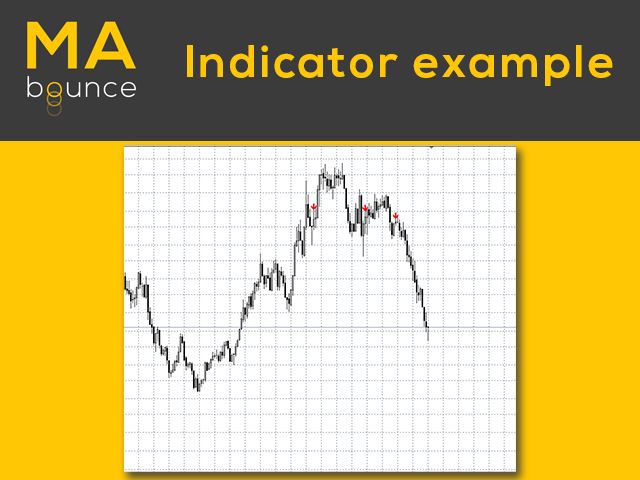
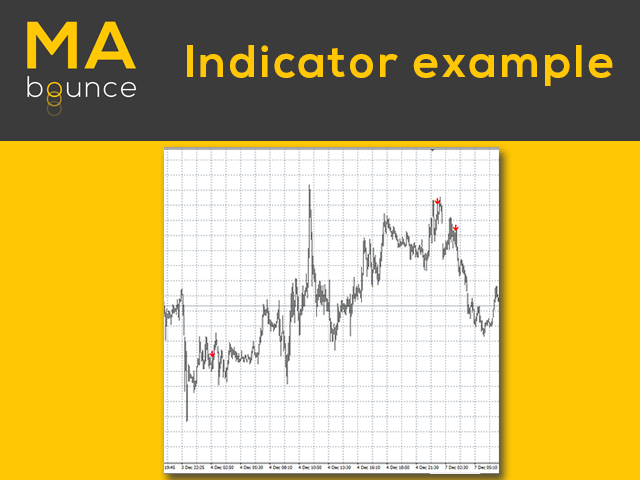
Las flechas MA bounce LITE son una versión simplificada del indicador principal MA bounce. Es para personas que no necesitan utilizar todas las características del indicador principal. La versión Lite sólo muestra flechas en el gráfico cuando hay una alta probabilidad de rebote del precio de la MA seleccionada.
MA bounce LITE flechas ajustes de entrada:
- Período actual dela MA - período de la media móvil en la TF actual
- Tipo de MA actual - método de cálculo de la media móvil en la TF actual
- Precio aplicado de la MA actual - precio aplicado de la media móvil en el TF actual
- Fuente de la línea TD para el cálculo - elija si los osciladores o los niveles de precios se utilizarán como fuente para el cálculo
- Método de línea TD (para fuente de osciladores) - elija entre cálculo a largo plazo o a corto plazo
- Periodo de filtrado (para fuente de osciladores) - establecer periodo para osciladores
- Período de promedio de la línea TD(para fuente de precio) - período de promedio de la línea TD
- Precisión de la línea TD (0.1 - 1) (para fuente de precio) - precisión del cálculo de la línea TD
- Bars limit - límite de barras para dibujar objetos indicadores
- HTF MA period - período de la media móvil en TF superior
- MA type - método de cálculo de la media móvil en TF superior
- MA applied price - precio aplicado de la media móvil en TF superior
- Timeframe for HTF MA - seleccionar marco de tiempo para HTF MA
- Usar alertas - activar/desactivar la alerta emergente
- Usar no tificaciones push - activar/desactivar notificaciones push
- Usar no tificaciones por email - activar/desactivar notificaciones por email
- Mostrar rebotes de HTF MA - mostrar/ocultar flechas en rebotes de HTF MA
- Estilo de flechaARRIBA - estilo wingdings para la flecha de COMPRA
- Estilo de flecha ABAJO - estilo wingdings para flecha VENDER
Para los códigos wingdings flecha visita:docs.mql4.com/constants/objectconstants/wingdings
Good