BeST Hull MAs Directional Strategy
- 지표
- 버전: 1.55
- 업데이트됨: 20 8월 2022
- 활성화: 10

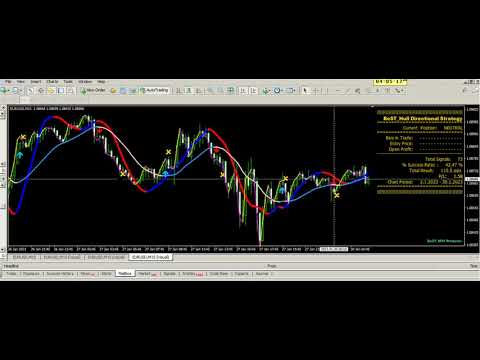
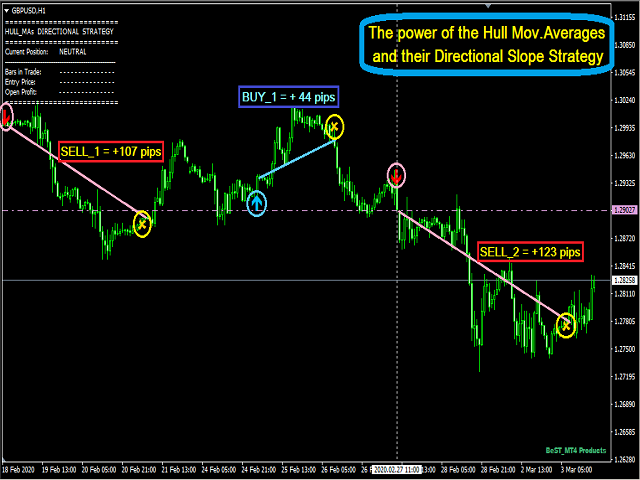
BeST_Hull MAs Directional Strategy is a Metatrader Indicator based on the corresponding Hull Moving Average.It timely locates the most likely points for Entering the Market as well as the most suitable Exit points and can be used either as a standalone Trading System or as an add-on to any Trading System for finding/confirming the most appropriate Entry or Exit points.This indicator does use only the directional slope and its turning points of Hull MAs to locate the Entry/Exit points while it also filters the Entries using a Hull MA of Larger LB_Period.
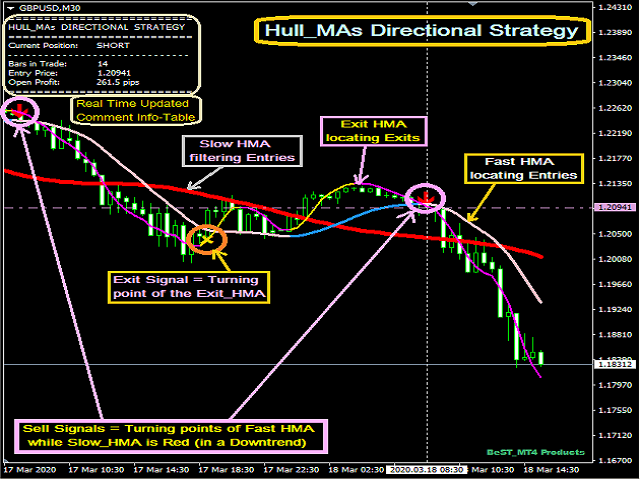
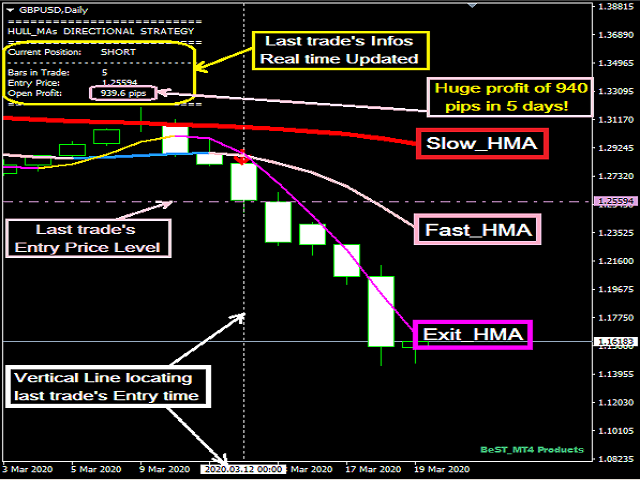
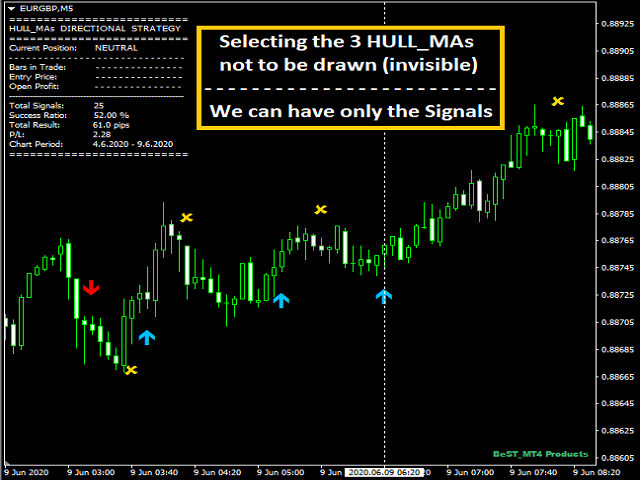
It consists of 3 Hull MAs (HMAs)
- Slow_HMA functionating as an Entry filter
- Fast_HMA for locating its turning points as Entry points
- Exit_HMA for locating its turning points as the corresponding Exits
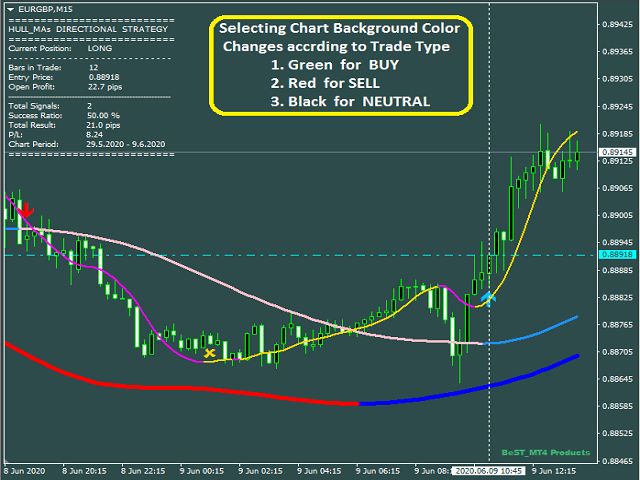
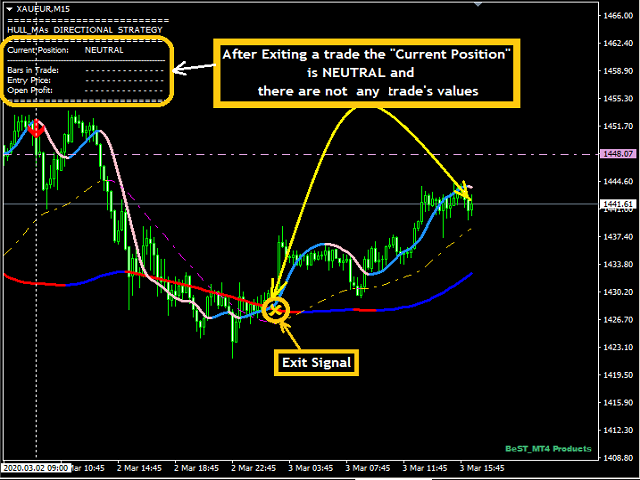
The Indicator comes with a new enhanced Real Time Updated Info and Statistics Panel that can improve its overall performance.
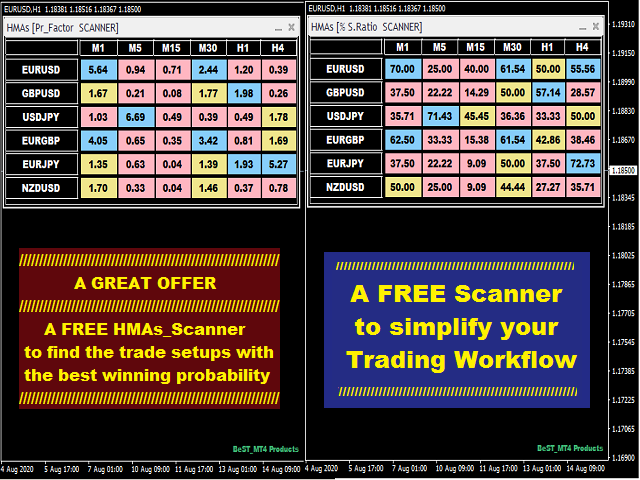
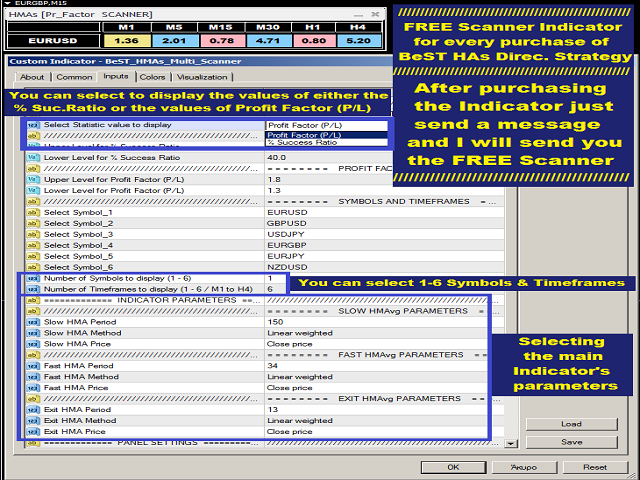
You can Maximize its potentiality by using our FREE OFFER for everyone who purchased the product that is a very useful Multi-Scanner Indicator displaying
% Success Ratio and Profit Factor (P/L) in order to find the most promising trading setups (Symbols and Timeframes).
The BeST_Hull MAs Directional Strategy Indicator:
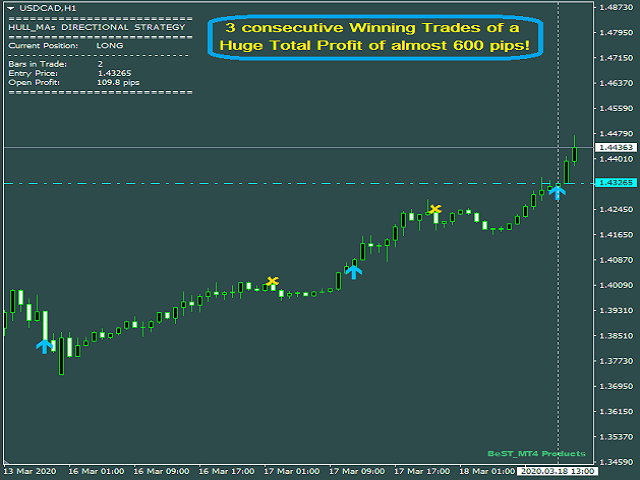
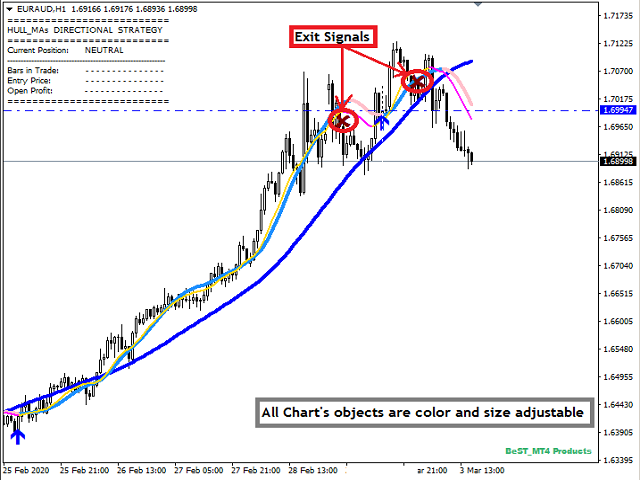
- Draws definite Entry Buy/Sell Arrows and Exit Signals
- Draws always only after the bar closing and so is non-repainting and non-backpainting
- Displays a real-time updated Info and Statistics Panel
- Runs in all symbols and timeframes
- Has fully customizable colors, sizes & distances of all Chart objects
- Comes up with sound Metatrader alert, email and push notification
- Cooperative with Expert Advisor development
Inputs
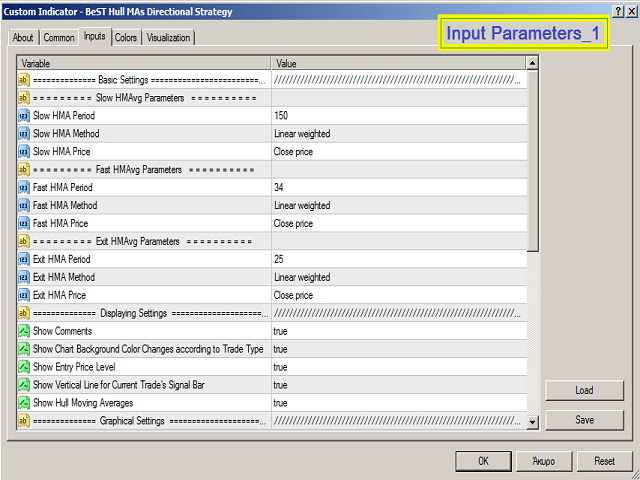
Basic Settings
- Slow_HMAvg Parameters – Period, Method and Price
- Fast_HMAvg Parameters – Period, Method and Price
- Exit_HMAvg Parameters – Period, Method and Price
Note: It is feasible the Fast_HMAvg and its turning points to be used for locating the Exit points if we use its parameters’ values as inputs for the Exit_HMAvg.
Displaying Settings - for selecting which chart objects and features to show/activate
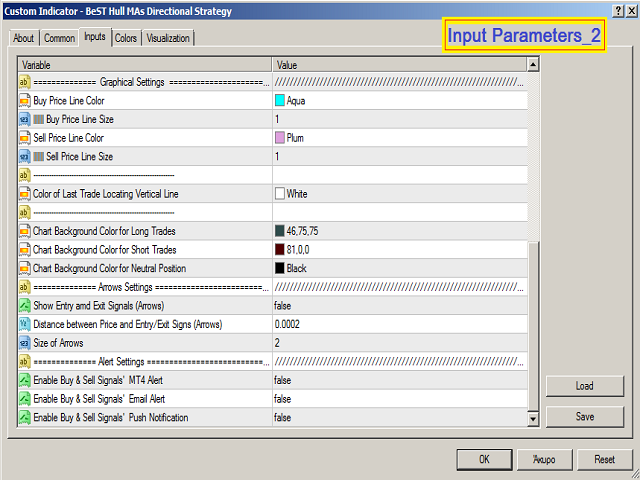
Graphical Settings - for selecting the color, size and distances of drawn objects
Arrows Settings – for controlling Entry/Exit arrows’ features
Alert Settings - for controlling the use of Entry and Exit points' MT4 alerts
For EA Developers
- Buy Arrows: Buffer = 2
- Sell Arrows: Buffer = 3
- Exit Signals: Buffer = 4


This indicator is exactly what I need. It saves me time and works efficiently. Eleni also gave great support. Thank you