HVK Auto MIDAS
- 지표
- 버전: 3.0
- 업데이트됨: 20 11월 2022
- 활성화: 5

Automatic MIDAS positioning, the indicator allows the placement of two MIDAS, each one have 3 lines that can be calculated using Open/High/Low/Close/Median/Typical or Weighted prices, you can attach each MIDAS to the Open/High/Low or Close bars of any day, including the current day, once attached, if the price of this bar changes or you change the time frame, the indicator will do the repositioning and recalculation.
You can also do a manual repositioning of the two MIDAS by moving its start label.
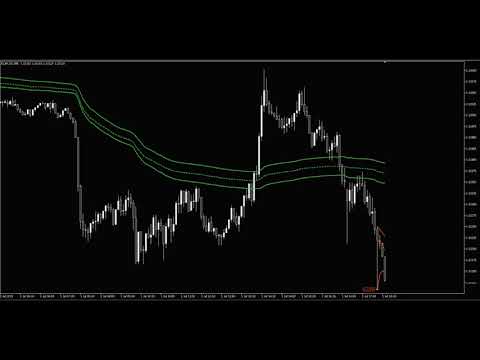
It is always risky being the first person to buy an indicator. I played with this thing for hours and got nowhere. It has 4 "modes" but with no instructions. I already own a MIDAS indicator and it works ok IF you can find the starting point, but because this is on MT5, I have no way of comparing. with two sets of lines (red and green) it can overwhelm the chart with lines crossing and gets confusing. I really dont know what it does, but thought it would work similar to the one I own. I give it 1.5 stars, but 3 because of the price...I am using this on the MetaQuotes MT5 available for free. My MT4 is FXChoice, but obviously i cannot use it on there. UPDATE 11-21-22. The Vendor has attempted to make changes. There is no doubt he is trying to solve this and one can tell he put a lot of work into the indicator. By faith, I will continue to figure it out and make it work. One star added. Again, the price was fair, although five activations is absurd for any Vendor. 10 should be minimum.