Hurst Exponent Indicator

Description

The Hurst exponent is referred to as the “index of dependence” or “index of long-range dependence”. It quantifies the relative tendency of a time series either to regress strongly to the mean or to cluster in a direction. A value H in the range 0.5–1 indicates a time series with long-term positive autocorrelation, meaning both that a high value in the series will probably be followed by another high value and that the values a long time into the future will also tend to be high. A value in the range 0 – 0.5 indicates a time series with long-term switching between high and low values in adjacent pairs, meaning that a single high value will probably be followed by a low value and that the value after that will tend to be high, with this tendency to switch between high and low values lasting a long time into the future. A value of H=0.5 can indicate a completely uncorrelated series, but in fact it is the value applicable to series for which the autocorrelations at small time lags can be positive or negative but where the absolute values of the autocorrelations decay exponentially quickly to zero ( Wikipedia).

In trading, the Hurst exponent can hint whether the product is trending or ranging around the moving average:

  1. Whenever the Hurst’s value is 0 <= H < 0.5, it might mean the product is ranging around the moving average.
  2. Whenever the Hurst’s value is 0.5 < H <= 1, it might mean that the product is trending towards a specific direction, either long or short.
  3. Whenever the Hurst’s value is 0.5, this value means that the product is either ranging nor trending.

Usage

  1. Save the HurstExponent.ex4 under the Indicators folder.
  2. Attach the HurstExponent.ex4 indicator to any product, select how many historical points you would like to calculate and see the result in the sub chart (the more historical points you calculate, the longer you would have to wait until the output chart is ready, must be >=1).

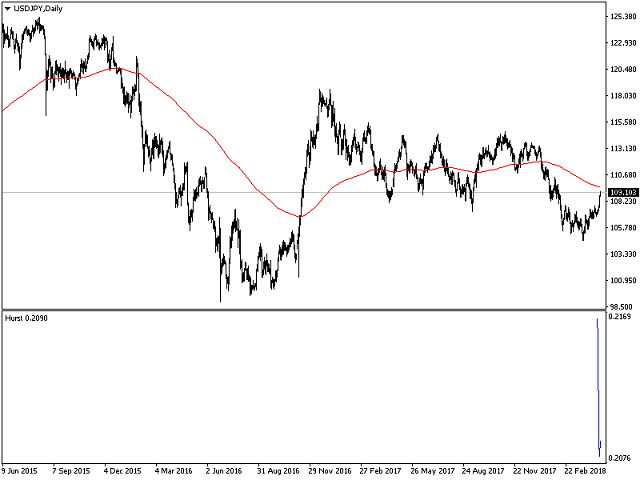
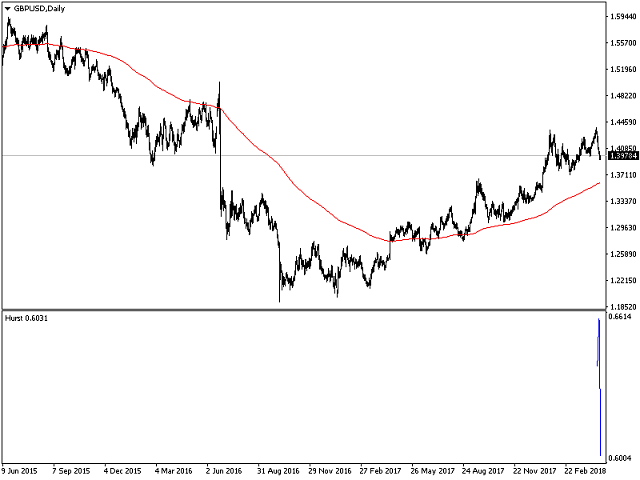
As seen in the attached images, I attached the Hurst exponent to two daily charts, USDJPY & GBPUSD:

For USDJPY, Hurst exponent value equals 0.2090 which is in the mean reverting range. We can see clearly that USDJPY daily price is fluctuating around the 200 days moving average without an obvious trend.

For GBPUSD on the other hand, Hurst exponent value equals 0.6031 which is in the trending range. We can see clearly that GBPUSD daily price has an upward trend above the 200 days moving average following a downward trend.


© 2019 Roy Meshulam

おすすめのプロダクト
The correlation coefficient reflects the relationship between two values. It shows the dependence of changes in one value on changes in another. For example, from changes in the price of EURUSD and EURNZD. The correlation coefficient in trade, currency relations is constantly changing. Special indicators of correlation help to define it, trace changes, draw correct conclusions. One of them is the Hubbles Correlator indicator. The indicator allows you to simultaneously display several other char
The "Market Profile" indicator displays the profiles and volumes of periods – weekly, daily, session (8-hour), 4-hour, hour, summary. The VAH/VAL price area is automatically highlighted by a dotted line for each profile (except for the summary). The indicator includes chroma Delta, which colors the profile areas. The areas of prevailing Buys is colored in green, that of Sells - in red. The intensity histogram features blue/red respectively. In the filter mode, the indicator displays the volume a
先着10名様に特別価格!価格が49ドルに上がる前に今すぐご購入ください。 Adaptive Trend Channel Pro v1.0 製品説明 【市場のノイズを排除】ボラティリティに自動適応する高精度トレンドチャネル 「Adaptive Trend Channel Pro v1.0」は、従来の固定幅チャネル(移動平均線±Pipsなど)の欠点を完全に解消するために開発されました。市場の 平均的なボラティリティ (ATR) に動的に合わせてチャネル幅が伸縮するため、レンジ相場でのダマシを避け、トレンド発生時の信頼性の高いエントリーシグナルを提供します。 このインジケーターの核となる優位性 ボラティリティ適応性 (ATRベース): 市場が静かな時はチャネルが狭くなり、市場が活発な時はチャネルが広がります。常に現在の市場環境に「適切な」取引レンジを表示します。 ノイズ排除: ボラティリティに応じてチャネル幅が変わるため、短期的なノイズによる無駄なシグナルが大幅に減少します。 2段階の高付加価値アラート: トレンド発生と平均回帰、2つの異なる戦略に対応した高精度なアラートを
Mr Beast Trend Reverse
Luis Mariano Vazquez Marcos
MR BEAST TREND REVERSE RECOMENDED H1 EUR USD La estrategia "Trend Reverse" en el mercado de divisas (Forex) es un enfoque utilizado para identificar puntos de reversión de tendencias y capturar cambios de dirección en los precios de los pares de divisas. Esta estrategia se basa en la premisa de que las tendencias del mercado no duran para siempre y que se producirán puntos de inflexión. Este robot de trading de Forex ha sido desarrollado por MRBEAST como una herramienta para facilitar el trading
Seconds Chart — MetaTrader 4で秒足チャートを作成するユニークなツールです。 Seconds Chart を使用すると、秒単位のタイムフレームでチャートを構築でき、標準的な分足や時間足チャートでは得られない柔軟性と分析精度を実現します。例えば、 S15 は15秒足を表します。あらゆるインジケーター、エキスパートアドバイザー、スクリプトを利用可能で、標準的なチャートと同様に便利に操作できます。 標準的なツールとは異なり、 Seconds Chart は超短期のタイムフレームでも高い精度と遅延なく作業できるように設計されています。 Seconds Chartの利点 1秒から900秒 までのタイムフレームをサポート。 瞬時の読み込み MT5ターミナルからのティックデータベースのインポートにより、過去データを即時利用可能。 MT5ターミナルで「 Tick Database 」ユーティリティを最初に起動する必要があります。 リアルタイムでデータが更新され、 遅延やラグなし 。 複数の秒足チャートを同時に作成可能。 Seconds Chartが最適な用途 スキャルピング
Pisces TheProfitZone "Pisces TheProfitZone MT4 Indicator Powered byFxGangster" This indicator will calculate new support and resistant zone everyday, and that give us a trading zone such as thats telling us TP and SL, So it still telling us for where should the price will go reach? Fore Example. Uptrend : If Price can stay upper a Line and price close higher above a Line, then the price will continue go up to reach next Line. Downtrend : If Price can't pass to stay upper a Line and the price
MACD Platinum
Kristmundur Roman Zakharii
This version of the MACD named MACD Platinum is the   MACD indicator calculated with ZeroLag moving averages (ZLEMA) .   ZLEMA is an abbreviation of   Zero Lag   Exponential   Moving Average . It was developed by John Ehlers and Rick Way. ZLEMA is a kind of Exponential   moving average   but its main idea is to eliminate the lag arising from the very nature of the   moving averages   and other trend following indicators.
Overview This is the DELUXE version in the Pivot Point Plotter Series. It is a robust indicator that dynamically calculates and plots any of the 4 major pivot points on your chart irrespective of intra day timeframe on which the indicator is placed. This indicator is capable of plotting STANDARD, CAMARILLA, FIBONNACI or WOODIE daily pivot points. Whichever you use in your trading, this indicator is your one-stop shop. Kindly note that it is a DAILY Pivot Point Plotter for DAY TRADERS who trade o
CANADIAN TAIGAは、ボラティリティーブレイクアウトとサポート/レジスタンスレベルのブレイクアウトの原則に基づいたトレンドフォロー型の取引システムを使用したプロフェッショナルポートフォリオEAです。すべてのカナダドルのペアで動作します。カナディアン・タイガの中核となる原理は、洗練されたヘッジモジュールを使用して、すべてのCADペアで取引機会を捉えることです。 CANADIAN TAIGAをダウンロードして、推奨されているようにすべてのカナダドルペアでテストしてみて、説明されているように意図されていることができない場合は、購入しないでください。主に最低時間枠(M5)で動作するため、モデリングの質の高さはあまり気にしないでください。 自動売買ボタンを無効にした状態でEAをチャート上で起動し、初期化後に自動売買を再度有効にするか、市場の時間外、できれば週末にチャート上で自動売買を有効にすることが非常に重要であり、強く推奨されます。なぜならば、EAは高速実行品質テストを行うために、初期化時に1回の迅速な単一取引(即時のオープンおよびクローズポジション)を実行する可能性があり、おそ
Description Better version of RSI indicator which offer a complete visual trading strategy and realize an auto-optimization Support:   We create great tools for the entire trading community. Most of them are free. If you believe in what we do  Support Us Here.   KEY LINKS:   How to Install  –  Frequent Questions  -  All Products  How is this indicator useful? NEVER repaints. Detect best parameters of RSI indicator, based on profit factor during the specified period. This indicator can be used as
Introduction to Fractal Pattern Scanner Fractal Indicator refers to the technical indicator that makes use of the fractal geometry found in the financial market. Fractal Pattern Scanner is the advanced Fractal Indicator that brings the latest trading technology after the extensive research and development work in the fractal geometry in the financial market. The most important feature in Fractal Pattern Scanner is the ability to measure the turning point probability as well as the trend probabi
Indicator Description GOLD TITAN KING SIGNAL INDICATOR High-Precision Gold Scalping Buy/Sell Signals – Manual Trading Assistant Overview The Gold Titan King Signal Indicator is a manual trading assistant tool designed for high-frequency scalping on Gold (XAUUSD) and other major pairs. It generates clear BUY/SELL signals with precise entry levels, along with adjustable Stop Loss and Take Profit levels displayed directly on the chart. ️ This tool is NOT an EA. It does not execute trades
The indicator sends messages to e-mail and mobile terminal when the price approaches the horizontal levels and trend lines that are drawn using the handy panel! The levels and trend lines are deleted and placed to the chart using one click on the panel, and they can be dragged on the chart by mouse! It is possible to set the interval between messages in the settings, the interval is applied to each object separately! Indicator Settings ===*** Main settings ***=== - below is the list of the main
This indicator is designed to help you forecast the potential high and low prices for the current trading day, based on the high and low of the previous day. It does this by applying a customizable percentage increase or decrease to those levels. How It Works: The idea is simple: It looks at the previous day's high and low prices and then adjusts them by a percentage you choose. Here's what that means: Predicted High: This is calculated by taking the high price of the previous day and adding a p
Snake NW
Sergei Shishaev
5 (1)
Канальный индикатор "Snake" . Отлично показывает точки входа и выхода. Не перерисовывает! Хорошо подойдет для стратегий с сетками (усреднения), стратегий с пирамидами (стратегий добора), обычной торговли по тренду, торговли на коррекции. Для любых типов инструментов:   валюты, нефть, металлы, криптовалюты. Для любых таймфреймов:   от M1 до D1 . Для любых стилей торговли:   скальпинг, интрадэй, свинг, долгосрок . Используйте в сочетании с трендовым индикатором, чтобы исключить риски входа про
The Elize Expert Advisor has been designed to work with the EURCHF currency pair. It considers the peculiarities of this trading instrument, its behavior and dependence on the behavior of other currencies. In particular, when the currencies of the European countries (EURUSD, GBPUSD, EURNOK, EURCHF) move in the same direction, the EA starts its operation and opens a deal in the trend direction of the European currencies. In the event of price rollbacks, the EA uses a unique method for making the
SR Breakout EA MT4 Launch Promo: Depending on the demand, the EA may become a paid product in the future. Presets:  Click Here Key Features: Easy Installation : Ready to go in just a few steps - simply drag the EA onto any chart and load the settings. Safe Risk Management: No martingale, grid, or other high-risk money management techniques. Risk management, stop loss, and take profit levels can be adjusted in the settings. Customizable Parameters: Flexible configuration for individual trading pr
FREE
This SuperZig indicator is special design for some trader trade with  ZigZag  and  Fibonacci . ( !!! NEW !!! +++ Support and Resistance +++ ) It will draw least two Fibonacci automatically in your chart period. Alerts when Created/Touced the Support/Resistance Box, it will send phone push/email notification to you at the same time. ZigZag + Fibo + BreakOutLine + SupportResistance = SuperZig !!! Input Parameter: " Show ZigZag " ::  Show ZigZag indicator with your own style ; " Show BreakOut Lin
NSA Prop Firm Robot EA for MT4 is an advanced trading algorithm specifically optimized for traders aiming to pass prop firm challenges such as FTMO, MyForexFunds, or FundedNext. I’ve personally tested this EA over several weeks, and I was impressed by how efficiently it balances profitability and risk — a key factor for any funded account strategy. The EA operates with strict drawdown control and steady profit accumulation. What differentiates NSA Prop Firm Robot EA from other automated systems
Overview Happy Kangaroo is a trend-following tool designed to identify market direction and provide high-probability entry signals based on volatility. By combining price action with the Average True Range (ATR), it visualize a dynamic support and resistance level of the price.     Key Features   The indicator's power lies in its customizable parameters and mathematical precision:  Dynamic Trend Detection: Uses the ATR period and factor to calculate the volatility bands. It identifies an Uptrend
Real Trend Alert
Geethika Rasnayake Mudiyanselage
The indicator can be used with any time frame and forex pair. One easy to use parameter in the indicator will allow you to adapt the signals to any forex pair and time frame you want to trade. The Arrows DO NOT REPAINT ! Information Panel: We've equipped this indicator with a user-friendly Panel.  one side of the panel, the time frame is displayed, while on the other side, the currency pair is shown. Below that, the direction of the trend is identified, showing whether it is an uptrend or a d
Septermber OFFER 85% OFF next price for unlimited version will be 2500$. This is the only time you can get this institutional and professional indicator at this price for unlimited version. Don't dare to miss this. The tool I am about to introduce to you you can't compare it with other tools due to its strategy and accuracy level in predicting the next price directional movement. This tool is designed for serious traders who have decided to make a difference through trading. Be the next person t
This is a professional Trend Sim indicator. The intelligent algorithm of the Trend Sim indicator accurately detects the trend, filters out market noise and generates input signals and exit levels. Functions with advanced statistical calculation rules improve the overall performance of this indicator. The indicator displays signals in a simple and accessible form in the form of arrows (when to buy and when to sell). Knowing the entry point of each of the currencies is very important for every f
This PRICE ACTION  trading EA is best for low risk steady growth. The EA has ability to smartly increase and decrease risk percent per trade  to maximize the gain. No INDICATORS are used of any kind. There is NO HEDGING or MARTINGALE. This Ea is fully set and forget based, but if you want you can also manually move your stop and profit target and can also close the trades whenever you want, it will not affect the EA algorithm. If You are new to robot trading, run with default settings. NOTE:
Alpha Trades — Adaptive Professional Trading System Author:   Andrii Sydoruk Version:   1.0 Release Date:   31.10.2025 Support:   andriisydoruk@gmail.com   Description Alpha Trades   is a next-generation universal trading expert, designed for stable and controlled operation under any market conditions. The system uses an adaptive analytical approach that automatically adjusts to the current market structure while maintaining a high level of accuracy and safety. The algorithm is built as
TPSproトレンドプロ     - これは市場を自動的に分析し、トレンドとその変化に関する情報を提供し、取引のエントリーポイントを表示するトレンドインジケーターです。     描き直しなしで! ИНСТРУКЦИЯ RUS   -   説明書 英語 -   バージョン MT5 主な機能: 正確なエントリーシグナル   塗り直し不要! 一度シグナルが現れたら、それは有効です!これは、シグナルを発した後にそれを変更し、潜在的に預金の損失につながる可能性のあるリペイントインジケーターとは大きく異なります。これにより、より高い確率と精度で市場に参入できるようになります。また、矢印が現れた後、目標(利益確定)に達するか反転シグナルが現れるまで、ローソク足の色を変更する機能もあります 。 ストップロス/テイクプロフィットゾーンの表示 エントリーポイントを探す際の視覚的な明瞭性を高めるため、市場における最適なエントリーポイントを探すためのBUY/SELLゾーンを最初に表示するモジュールを作成しました。また、ストップロスレベルを時間経過とともに管理するインテリジェントなロジックを追加することで、ス
The principle of this indicator is very simple: detecting the return point with Stochastic Oscillator, then monitoring the trend by using the Moving Average and finally predicting BUY and SELL signal with arrows, alerts and notifications. The parameters are fixed and automatically calculated on each timeframe. Example: If you install indicator on EURUSD, the indicator will detect the return point when the Stochastic Oscillator show "cross up" of the main line/signal line at the below position of
Product Description: Trading Vision – Automated Assistant for Forex Traders Introduction In today's financial markets, automating Forex trading is not just desirable but essential for success. The primary goal of automated trading systems like Trading Vision is to simplify the trading process by implementing advanced algorithms to analyze market trends. This allows traders to focus on strategic thinking while leaving routine operations to technology. What is Trading Vision? Trading Vision is a p
1.Determine the trend size based on the chart cycle.   An uptrend near the highest price in a period of time.   A trend down near the lowest price in a period of time. 2.   short-term trends.   Oversold and long;   Overbought, short. 3. Unwind positions based on overbought and oversold and profit points. real-time signal: https://www.mql5.com/zh/signals/1538661?source=Site+Signals+My EA Settings: You need to load EA into the currency pair to trade (M15 time range). The best performing symbol : E
Dynamic Price Volatility Indicator (DPVI) The Dynamic Price Volatility Indicator (DPVI) is designed to provide traders with valuable insights into market volatility and potential price movements. It combines elements of volatility analysis and trend identification to assist traders in making informed trading decisions. Features: Dynamic Volatility Bands: utilizes a proprietary algorithm to calculate dynamic volatility bands that adjust in real-time based on market conditions. These bands act a
FREE
このプロダクトを購入した人は以下も購入しています
Precautions for subscribing to indicator This indicator only supports the computer version of MT4 Does not support MT5, mobile phones, tablets The indicator only shows the day's entry arrow The previous history arrow will not be displayed (Live broadcast is for demonstration) The indicator is a trading aid Is not a EA automatic trading No copy trading function The indicator only indicates the entry position No exit (target profit)  The entry stop loss point is set at 30-50 PIPS Or the front hi
Gann Made Easy は、ミスター・ギャンの理論を使用した取引の最良の原則に基づいた、プロフェッショナルで使いやすい外国為替取引システムです。 W・D・ガン。このインジケーターは、ストップロスとテイクプロフィットレベルを含む正確な買いと売りのシグナルを提供します。 PUSH通知を利用して外出先でも取引可能です。 購入後に私に連絡して、取引のヒント、ボーナス、および「GANN MADE EASY」EA アシスタントを無料で入手してください。 おそらく、ギャンの取引手法についてはすでに何度も聞いたことがあるでしょう。通常、ギャンの理論は初心者のトレーダーだけでなく、すでにある程度の取引経験がある人にとっても非常に複雑なものです。なぜなら、ギャンの取引手法は理論的にはそれほど簡単に適用できるものではないからです。私はその知識を磨き、最良の原則を私の外国為替インジケーターに組み込むために数年を費やしました。 このインジケーターは非常に簡単に適用できます。必要なのは、それをチャートに添付し、簡単な取引推奨事項に従うだけです。このインジケーターは常に市場分析の仕事を行い、取引の機会を探しま
M1 SNIPER は使いやすいトレーディングインジケーターシステムです。M1時間足向けに設計された矢印インジケーターです。M1時間足でのスキャルピングのためのスタンドアロンシステムとして、また既存のトレーディングシステムの一部としても使用できます。このトレーディングシステムはM1時間足での取引に特化して設計されていますが、他の時間足でも使用できます。元々、この手法はXAUUSDとBTCUSDの取引用に設計しましたが、他の市場においても役立つと考えています。 インジケーターのシグナルは、トレンドの方向と逆方向に取引できます。インジケーターのシグナルを利用して両方向に取引するのに役立つ特別な取引テクニックをご紹介します。この手法は、特別な動的なサポートとレジスタンスの価格帯を利用することに基づいています。 ご購入後、M1 SNIPER矢印インジケーターをすぐにダウンロードできます。さらに、M1 SNIPERツールのすべてのユーザーに、以下のスクリーンショットに表示されているApollo Dynamic SRインジケーターを無料で提供しています。この2つのインジケーターを組み合わせることで
Game Changerは、あらゆる金融商品で使用できる革新的なトレンドインジケーターです。MetaTraderを強力なトレンドアナライザーへと変貌させます。あらゆる時間枠で動作し、トレンドの特定、反転の可能性のシグナル、トレーリングストップ機能、そして迅速な市場反応のためのリアルタイムアラートを提供します。経験豊富なプロでも、優位性を求める初心者でも、このツールは自信と規律、そして根本的なトレンドダイナミクスを明確に理解した上で取引を行うための力となります。このインジケーターはリドロー機能も備えています。 購入後すぐにご連絡いただければ、個人ボーナスを進呈いたします。Strong SupportとTrend Scannerインジケーターの無料コピーを入手できます。[email protected]までプライベートメッセージを送ってください。 私のEAや特別なセットはTelegramでは販売しておりません。MQL5でのみ販売しており、セットファイルは私のブログでのみ公開しています。詐欺師にはご注意ください。他の方からセットを購入しないでください。 設定 トレンド変化時のアラート
Meravith
Ivan Stefanov
5 (2)
マーケットメーカーのためのツール。 Meravith は次の機能を提供します: すべての時間足を分析し、現在有効なトレンドを表示します。 強気と弱気の出来高が等しくなる流動性ゾーン(出来高均衡)を強調表示します。 異なる時間足のすべての流動性レベルをチャート上に直接表示します。 テキスト形式の市場分析を生成し、参考情報として表示します。 現在のトレンドに基づいて目標値、サポートレベル、ストップロスを計算します。 取引のリスクリワード比を算出します。 口座残高に基づいてポジションサイズを計算し、潜在的な利益を推定します。 また、市場に大きな変化があった場合には警告を表示します。 インジケーターの主要ライン: 強気/弱気の出来高エグゾーストライン ― 目標値として機能します。 市場のトレンドを示すライン。市場が強気か弱気かによって色が変わり、トレンドのサポートとして機能します。主にその色が市場センチメントを示します。 出来高均衡ライン(Eq)。Eq(Volume Equilibrium)ラインはシステムの中核です。これは買い手と売り手の出来高のバランスポイントを表します。市場の流動性を示し
Miraculous Indicator – ガン・スクエア・オブ・ナインに基づく100%非リペイントのFXおよびバイナリーツール この動画では、FXおよびバイナリーオプションのトレーダー向けに特別に開発された、非常に正確で強力な取引ツールである Miraculous Indicator を紹介しています。このインジケーターがユニークなのは、伝説的な ガン・スクエア・オブ・ナイン と ガンの振動の法則 に基づいている点で、現代の取引で利用できる最も正確な予測ツールの一つとなっています。 Miraculous Indicatorは 完全に非リペイント であり、ローソク足が確定した後にシグナルが変化したり消えたりすることはありません。つまり、見たものがそのまま利用できます。これにより、トレーダーは自信を持ってエントリーおよびエグジットを行うための信頼性と一貫性のある根拠を得ることができます。 主な特徴: ガン・スクエア・オブ・ナインとガン理論に基づいて構築 100%非リペイントのシグナルシステム すべての時間枠(M1、M5、H1、H4、日足、週足)で機能 FXおよびバイナリーオプション取引
現在40%OFF! 初心者やエキスパートトレーダーのためのベストソリューション! このダッシュボードソフトウェアは、28の通貨ペアで動作しています。それは私達の主要な指標(高度な通貨の強さ28と高度な通貨インパルス)の2に基づいています。それは全体の外国為替市場の大きい概観を与えます。それは、すべての(9)時間枠で28の外国為替ペアのための高度な通貨の強さの値、通貨の動きの速度と信号を示しています。チャート上で1つのインディケータを使用して市場全体を観察し、トレンドやスキャルピングの機会をピンポイントで見つけることができたら、あなたのトレードがどのように改善されるか想像してみてください。 このインディケータには、強い通貨と弱い通貨の識別、潜在的な取引の識別と確認がより簡単になるような機能が搭載されています。このインディケータは、通貨の強さや弱さが増加しているか減少しているか、また、すべての時間枠でどのように機能しているかをグラフィカルに表示します。 新機能として、現在の市場環境の変化に適応するダイナミックなマーケットフィボナッチレベルが追加され、すでに当社のAdvanced
Looking for a powerful yet lightweight swing detector that accurately identifies market structure turning points? Want clear, reliable buy and sell signals that work across any timeframe and any instrument? Buy Sell Arrow MT Swing is built exactly for that — precision swing detection made simple and effective. This indicator identifies Higher Highs (HH) , Higher Lows (HL) , Lower Highs (LH) , and Lower Lows (LL) with remarkable clarity. It is designed to help traders easily visualize market str
ゴールドラッシュ・トレンド・アロー・シグナル ゴールドラッシュ・トレンド・アロー・シグナル 指標は、XAU/USDにおける高速・短期スキャルパー向けに最適化された、正確でリアルタイムのトレンド分析を提供します。 1分足専用に設計されたこのツールは、明確なエントリーポイントを示す方向矢印を表示し、スキャルパーが変動の激しい市場状況でも自信を持って取引できるよう支援します。 この指標は、PRIMARY(主要)とSECONDARY(補助)のアラート矢印で構成されています。PRIMARYシグナルは、トレンドの方向転換を示す白と黒の方向矢印であり、SECONDARYシグナルは、PRIMARY矢印が示す方向を確認し、潜在的なエントリーポイントを示す青と赤の矢印です。 注意:トレンド方向の変化後にPRIMARYアラート矢印が1つだけ表示される場合、複数のSECONDARY青/赤矢印が表示される点に注意が必要です。SECONDARYシグナルは、シグナル基準を満たす任意のローソク足後に表示されます。したがって、長期的なトレンド移動の場合、画面に多くのSECONDARY矢印が表示されます(添付の
Trend indicator AI
Ramil Minniakhmetov
4.66 (80)
Trend Ai indicatorは、トレンドの識別と実用的なエントリポイントと反転アラートを組み合わせることで、トレーダーの市場分析を強化する優れたツールです。 この指標は、ユーザーが自信と正確さで外国為替市場の複雑さをナビゲートすることを可能にします トレンドAiインジケーターは、主要なシグナル以外にも、プルバックやリトレースメント中に発生するセカンダリエントリポイントを識別し、トレーダーが確立されたトレンド内の価格修正を活用できるようにします。 重要な利点: *MT4およびMT5の仕事 *明確な買いまたは売りシグナル *再描画しません ·すべての資産で動作します 私はeaやセットをtelegram it詐欺で販売しないように注意してください。 すべての設定はここでブログで無料です。  重要! 指示とボーナスを得るために購入後すぐに私に連絡してください! 私の他のプロダクトと同様、実質操作の監視はここに見つけることができます: https://www.mql5.com/en/users/mechanic/seller&nbsp ; 設定および入力: すべての
FX Power: 通貨の強弱を分析して、より賢い取引を実現 概要 FX Power は主要通貨と金の実際の強弱をあらゆる市場状況で理解するための必須ツールです。強い通貨を買い、弱い通貨を売ることで、 FX Power は取引の意思決定を簡素化し、高い確率の取引機会を見出します。トレンドを追従する場合でも、極端なデルタ値を使用して反転を予測する場合でも、このツールはあなたの取引スタイルに完全に適応します。ただ取引するだけではなく、 FX Power で賢く取引をしましょう。 1. なぜ FX Power がトレーダーにとって非常に有益なのか 通貨と金のリアルタイム強弱分析 • FX Power は主要通貨と金の相対的な強弱を計算し、マーケットダイナミクスに関する明確な洞察を提供します。 • どの資産がリードしているか、または後れを取っているかを監視して、取引するペアを賢く選びましょう。 マルチタイムフレームの包括的なビュー • 短期、中期、長期のタイムフレームで通貨と金の強弱を追跡し、マーケットトレンドに基づいて取引戦略を調整できます。 • スキャルピングからスイングトレード
An exclusive indicator that utilizes an innovative algorithm to swiftly and accurately determine the market trend. The indicator automatically calculates opening, closing, and profit levels, providing detailed trading statistics. With these features, you can choose the most appropriate trading instrument for the current market conditions. Additionally, you can easily integrate your own arrow indicators into Scalper Inside Pro to quickly evaluate their statistics and profitability. Scalper Inside
通貨強さウィザードは、取引を成功させるためのオールインワン ソリューションを提供する非常に強力な指標です。このインジケーターは、複数の時間枠のすべての通貨のデータを使用して、このまたはその外国為替ペアのパワーを計算します。このデータは、使いやすい通貨インデックスと通貨パワーラインの形式で表され、特定の通貨のパワーを確認するために使用できます。 必要なのは、取引したいチャートにインジケーターを接続することだけです。インジケーターは、取引する通貨の実際の強さを示します。このインジケーターは、トレンドに合わせて取引するときに有利に利用できる売買高の圧力の極値も示します。このインジケーターには、フィボナッチに基づく可能なターゲットも表示されます。 このインジケーターは、PUSH 通知を含むあらゆるタイプのアラートを提供します。 購入後ご連絡下さい。私の取引のヒントをあなたと共有し、素晴らしいボーナスインジケーターを無料で提供します! 幸せで有益な取引をお祈りします。
"Dragon's Tail" is an integrated trading system, not just an indicator. This system analyzes each candle on a minute-by-minute basis, which is particularly effective in high market volatility conditions. The "Dragon's Tail" system identifies key market moments referred to as "bull and bear battles". Based on these "battles", the system gives trade direction recommendations. In the case of an arrow appearing on the chart, this signals the possibility of opening two trades in the indicated directi
First 25 copies at $80, after that price becomes $149 (3 copies left) Gold Signal Pro is a powerful MT4 indicator designed to help traders spot strong price reactions in the market. It focuses on clear wick rejections , showing when price strongly rejects a level and often continues in the same direction. Gold Signal Pro is mainly built for scalping gold (XAUUSD) and works best on lower timeframes like M5 and M15 , where timing matters most. That said, it can also be used on any forex pair, a
Scalper Vault は、スキャルピングを成功させるために必要なすべてを提供するプロフェッショナルなスキャルピング システムです。このインジケーターは、外国為替およびバイナリー オプションのトレーダーが使用できる完全な取引システムです。推奨される時間枠は M5 です。 システムは、トレンドの方向に正確な矢印シグナルを提供します。また、トップとボトムのシグナルとギャン マーケット レベルも提供します。 インジケーターは、プッシュ通知を含むすべてのタイプのアラートを提供します。 インジケータの購入後にご連絡ください。私の個人的な取引の推奨事項と素晴らしいボーナス指標を無料で共有します! 幸せで有益な取引をお祈りします!
Gold Scalper Super is an easy-to-use trading system. The indicator can be used as a standalone scalping system on the M1 time frame, as well as part of your existing trading system. Bonus: when purchasing an indicator, Trend Arrow Super is provided free of charge, write to us after purchase. The indicator 100% does not repaint!!! If a signal appears, it does not disappear! Unlike indicators with redrawing, which lead to the loss of a deposit, because they can show a signal and then remove it.
Presenting one-of-a-kind Gann Indicator for XAUUSD IQ Gold Gann Levels is a non-repainting, precision tool designed exclusively for XAUUSD/Gold intraday trading. It uses W.D. Gann’s square root method to plot real-time support and resistance levels, helping traders spot high-probability entries with confidence and clarity. William Delbert Gann (W.D. Gann) was an exceptional market analyst whose trading technique was based on a complex blend of mathematics, geometry, astrology, and ancient calcul
Apollo SR Master は、サポート/レジスタンスゾーンを利用した取引をより容易かつ確実にする特別な機能を備えたサポート/レジスタンスインジケーターです。このインジケーターは、ローカル価格の高値と安値を検出することで、タイムラグなしでリアルタイムにサポート/レジスタンスゾーンを計算します。そして、新たに形成されたSRゾーンを確認するために、インジケーターは特別なシグナルを表示します。このシグナルは、SRゾーンを実際の売りまたは買いシグナルとして考慮して使用できることを示します。この場合、SRゾーンの強度が高まり、SRエリアからの取引が成功する確率も高まります。これがこのインジケーターの基本的な考え方です。 SRゾーンは、ストップロスとテイクプロフィットの設定を容易にします。シグナルの方向に応じて、SRゾーンの上または下のスペースをストップロスとして設定できます。さらに、反対側のSRゾーンは、潜在的なテイクプロフィットエリアとして設定できます。 また、Apollo SRマスターインジケーターをご利用のすべてのユーザーには、「Apollo Price Action System」
Super Signal – Skyblade Edition プロ仕様のノンリペイント / ノーラグ・トレンドシグナルシステム。卓越した勝率を実現 | MT4 / MT5 対応 1分足、5分足、15分足などの低い時間足で最も効果を発揮します。 主な特徴: Super Signal – Skyblade Edition は、トレンド取引に特化したスマートなシグナルシステムです。マルチレイヤーのフィルターロジックを用いて、明確な方向性と実際のモメンタムに支えられた強力なトレンドのみを検出します。 このシステムは 天井や底を予測するものではありません 。次の3つの条件がすべて満たされた場合にのみシグナルを発生させます: 明確なトレンド方向 モメンタムの増加 健全なボラティリティ構造 市場セッションに基づく流動性分析と組み合わせることで、シグナルの精度とタイミングがさらに向上します。 シグナルの特性: すべての矢印シグナルは 100% 非リペイント / 遅延なし 一度出現したシグナルは固定され、点滅・消失しません チャート上の矢印、情報パネル、ポップアップ通知、音声アラート、プッシュ通知
Pulse Scalping Line - an indicator for identifying potential pivot points. Based on this indicator, you can build an effective Martingale system. According to our statistics, the indicator gives a maximum of 4 erroneous pivot points in a series. On average, these are 2 pivot points. That is, the indicator shows a reversal, it is erroneous. This means that the second signal of the indicator will be highly accurate. Based on this information, you can build a trading system based on the Martingale
MetaForecast M4
Vahidreza Heidar Gholami
5 (2)
MetaForecastは、価格データのハーモニクスに基づいて、どんな市場の未来を予測し視覚化します。市場が常に予測可能ではありませんが、価格にパターンがある場合、MetaForecastは可能な限り正確な未来を予測できます。他の類似製品と比較して、MetaForecastは市場のトレンドを分析することでより正確な結果を生成することができます。 入力パラメータ Past size (過去のサイズ) MetaForecastが将来の予測を生成するために使用するバーの数を指定します。モデルは選択したバー上に描かれた黄色の線で表されます。 Future size (将来のサイズ) 予測すべき将来のバーの数を指定します。予測された将来は、ピンクの線で表示され、その上に青い回帰線が描かれます。 Degree (程度) この入力は、MetaForecastが市場で行う分析のレベルを決定します。 Degree 説明  0 Degree 0の場合、価格の全てのピークや谷、そして詳細をカバーするために、「Past size」の入力に大きな値を使用することが推奨されています。  1 (推奨) Degre
Volatility Trend System - a trading system that gives signals for entries. The volatility system gives linear and point signals in the direction of the trend, as well as signals to exit it, without redrawing and delays. The trend indicator monitors the direction of the medium-term trend, shows the direction and its change. The signal indicator is based on changes in volatility and shows market entries. The indicator is equipped with several types of alerts. Can be applied to various trading ins
FX Volume
Daniel Stein
4.63 (38)
FX Volume:ブローカー視点で捉える本物の市場センチメント クイック概要 トレード手法をさらに高めたいとお考えですか? FX Volume は、リテールトレーダーやブローカーのポジション状況をリアルタイムで提供します。これは、COTのような遅延レポートよりもはるかに早く知ることができます。安定した利益を目指す方も、さらなる優位性を求める方も、 FX Volume は大きな不均衡を見極め、ブレイクアウトを確認し、リスク管理を洗練させるのに役立ちます。今すぐ始めて、実際の出来高データがどのように意思決定を変革するかを体感してください! 1. FX Volume がトレーダーにとって非常に有益な理由 高精度の早期警戒シグナル • 各通貨ペアを売買しているトレーダー数を、他者よりも早く、ほぼリアルタイムで把握できます。 • FX Volume は、複数のリテールブローカーから得られる本物の出来高データを収集し、分かりやすい形式で提供する 唯一 のツールです。 強力なリスク管理 • ロングやショートの大きな偏り(インバランス)を特定し、潜在的なトレンド転換を見逃しません。ストップ
まず第一に、この取引インジケーターは再描画されず、再描画されず、遅延しないことを強調する価値があります。これにより、手動取引とロボット取引の両方に理想的なものになります。 ユーザーマニュアル:設定、入力、戦略。 アトミックアナリストは、価格の強さとモメンタムを利用して市場でより良いエッジを見つけるためのPA価格アクションインジケーターです。ノイズや誤ったシグナルを除去し、取引ポテンシャルを高めるための高度なフィルターを備えています。複雑なインジケーターの複数のレイヤーを使用して、アトミックアナリストはチャートをスキャンし、複雑な数学的計算をシンプルなシグナルと色に変換します。これにより、どのような初心者トレーダーでも理解して使用し、一貫した取引の決定を行うことができます。 「アトミックアナリスト」は、新規および経験豊富なトレーダー向けにカスタマイズされた包括的な取引ソリューションです。プレミアムインジケーターとトップノッチの機能を1つの取引戦略に組み合わせ、すべてのタイプのトレーダーにとって汎用性のある選択肢にします。 デイリートレーディングとスキャルピング戦略:高速で正確な
Introducing a powerful, precision-engineered indicator that seamlessly combines Pivot Points, Moving Averages, and Multi-Timeframe Analysis to deliver high-probability Buy and Sell signals in real-time. This tool is your strategic edge, designed to identify trend reversals, market momentum, and optimal trade entries, no matter your preferred trading style. Our algorithm goes beyond standard indicators—by analyzing multiple timeframes simultaneously, it spots true market turning points while fi
M1 Arrow
Oleg Rodin
4.81 (21)
市場の2つの基本原則に基づく日中戦略。 このアルゴリズムは、追加のフィルターを使用したボリュームと価格の波の分析に基づいています。インディケータのインテリジェントアルゴリズムは、2つの市場要因が1つに結合した場合にのみシグナルを出します。インディケータは、より高い時間枠のデータを使用して、M1チャート上の特定の範囲の波を計算します。そして波を確認するために、インジケーターはボリュームによる分析を使用します。 このインディケータはレディトレーディングシステムです。トレーダーが必要とするのは、信号に従うことだけです。また、インジケーターはあなた自身の取引システムの基礎になることができます。取引はミニッツチャートでのみ行われます。 インジケーターがMTFの原則を使用しているという事実にもかかわらず、インジケーターのアルゴリズムは可能な限り安定しています。 購入後、必ず私に書いてください!私の取引設定と推奨事項をあなたと共有します!
SHOGUN Trade - 16年間無調整の衝撃。戦略的市場構造と損小利大の極意 2月スペシャルセール – 特別価格 $88(通常価格 $199)! Click here for the MT5 version   https://www.mql5.com/ja/market/product/160183 これが最新のリリースです。 https://www.mql5.com/ja/market/product/165983   この特別オファーは 2月28日 までの期間限定です。 私たちは現在、 さらなる製品開発と最適化 に注力しております。皆様からの貴重なフィードバックを製品に反映させるため、レビューへのご協力を条件にこの割引価格で提供させていただきます。皆様からいただくご意見は、次回のアップデートや新機能の追加に直接活用させていただきます。 開発者も戦慄した「16年間」の真実 まず、添付した画像(バックテスト結果)をご覧ください。これはUSDJPY H1における、**2010年1月1日から2026年1月1日までの「丸16年間」**の検証結果です。 これはEA(自動売買
Full Fledged EA and Alert plus for alerts will also be provided in this offer along with the purchase of Indicator. Limited copies only at this price and Ea too. Grab your copy soon Alert plus for indicator with set file is kept in comment section with the image  SMC Blast Signal with FVG, BOS and trend Breakout The SMC Blast Signal is a Precise trading system for Meta Trader 4 that uses Smart Money Concepts (SMC), including Fair Value Gaps (FVG) and Break of Structure (BOS), to identify high-pr
Weis Wave with Alert
Trade The Volume Waves Single Member P.C.
4.82 (22)
Rental/Lifetime Package Options and Privileges' Rent Monthly Six Months   Yearly/Lifetime Weis Wave with Speed with Alert+Speed Index x x x Manual  x x x Quick Set up Video x x x Blog x x x Lifetime Updates x x x Setup and Training Material x x Rectangle Break Alert Tool      x Discord Access Channel "The SI traders" x   How to trade info visit:    http://www.tradethevolumewaves.com   ** If you purchase please contact me to setup your  : training Room and  complete manual access.  This is
作者のその他のプロダクト
Introduction Professional traders use pivot points as support/resistance levels or as an indicator of a trend. Basically, a pivot point are areas at which the direction of price movement can  possibly  change. What makes pivot points so popular is their objectivity as they are recalculated each time the price moves further. The pivot points indicator implements 5 popular pivot points calculation and drawing: Standard –  The most basic and popular type of the pivots, each point serve as an indica
Introduction It is common practice for professional trades to hide their stop loss / take profit from their brokers. Either from keeping their strategy to the themselves or from the fear that their broker works against them. Using this indicator, the stop loss / take profit points will be drawn on the product chart using the bid price. So, you can see exactly when the price is hit and close it manually.  Usage Once attached to the chart, the indicator scans the open orders to attach lines for t
With the Market View Indicator , you may monitor in a dedicated panel as many as products as you wish. Just add the indicator to the chart, enter the prodcuts you want to view and the change period to track and that's it. A panel will open up at the bottom of the chart which will show you per product the change in pips, the standard deviation, the return etc.  Personally, I use it to track multiple products I have positions with without having multiple charts opened up, it save me bandwith and t
Breakeven calcualtor is a Metatrader 4 indicator which calculates and displays the breakeven value for the open P&L. The value is updated dynamically based on market movements and changes. If the overall P&L is negative, the breakeven point will be displayed as a red value, otherwise green. Besides the breakeven, the following values are also displayed: Pips sum P&L change per minute Pips change per minute P&L total Swap total Commisions total 2019 Roy Meshulam
Period trend indicator calculates and displays the changes in: Trend Pips Standard Deviation Return (%) in the following periods - M1, M5, M15, M30, H1, H4, W1, MN1, MN3, MN6, Y1 and Year to Date.  By default, the current product is used, but it can any product when you attached the indicator to the chart.  I used extensively to monitor the product changes accross multiple charts wihtout having the need to open them in paralle.  2019 Roy Meshulam
In  finance , volatility (symbol σ) is the degree of variation of a trading price series over time as measured by the  standard deviation  of  logarithmic returns . Historic volatility measures a time series of past market prices.  Implied volatility  looks forward in time, being derived from the market price of a market-traded derivative (in particular, an option). In 2000 Yang-Zhang created a volatility measure that handles both opening jumps and drift. It is the sum of the overnight volatilit
The Chart Overlay indicator displays the price action of different products on the same chart, allowing you to evaluate how different symbols fluctuate relative to each other. You may use it to make trading decisions based on convergence / divergence of the displayed products, i.e. USDCAD - XTIUSD, EURUSD - USDCHF etc.  Usage Find overbought or oversold products Adapts to chart size, zoom and timeframe Automatic price level calculation Customizable colors Click 'c' to open underline product in s
What Is the Coppock Curve? The Coppock Curve is a long-term price momentum indicator used primarily to recognize major downturns and upturns in a stock market index. It is calculated as a 10-period weighted moving average of the sum of the 14-period rate of change and the 11-period rate of change for the index. It is also known as the "Coppock Guide." Example of How to Use the Coppock Curve Apply the Coppock Curve to a weekly/monthly price chart of a stock index or stock index exchange traded f
フィルタ:
レビューなし
レビューに返信