EZT Daily Data ADR
- Indicadores
- Versión: 1.10
- Actualizado: 17 abril 2020
- Activaciones: 10

Se trata de una herramienta de gran utilidad para ver información valiosa en su gráfico.
El panel es de flotación libre, agárralo con el ratón y muévete por la carta con facilidad. Además, el panel es plegable para que puedas ahorrar espacio y ver sólo la información que desees.
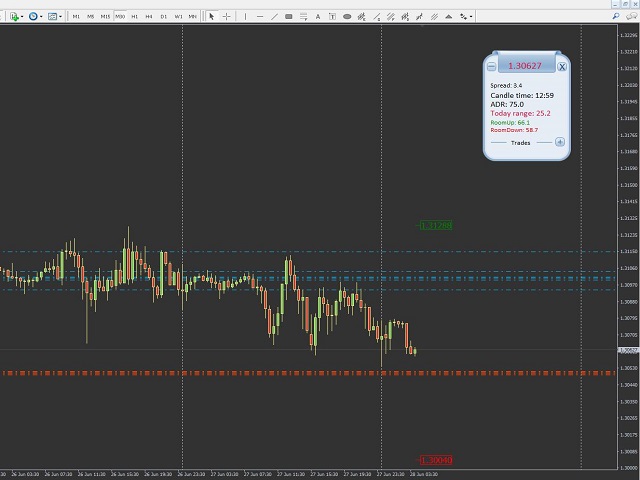
Hay tres secciones en el panel, cuando está cerrado sólo puedes ver la sección superior.
Aquí tienes la lista de información que puedes ver en el panel, de arriba a abajo:
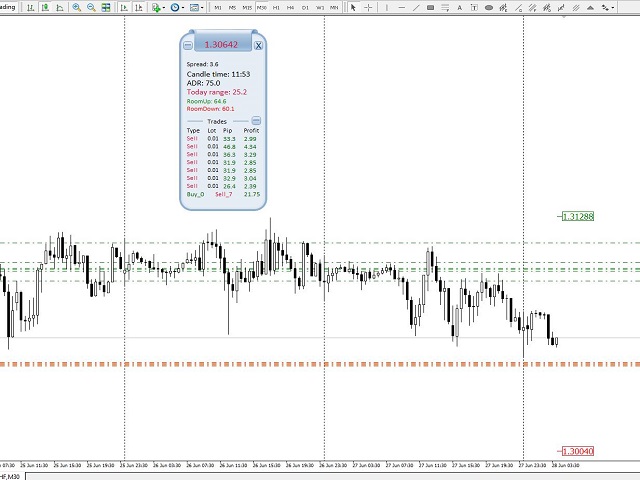
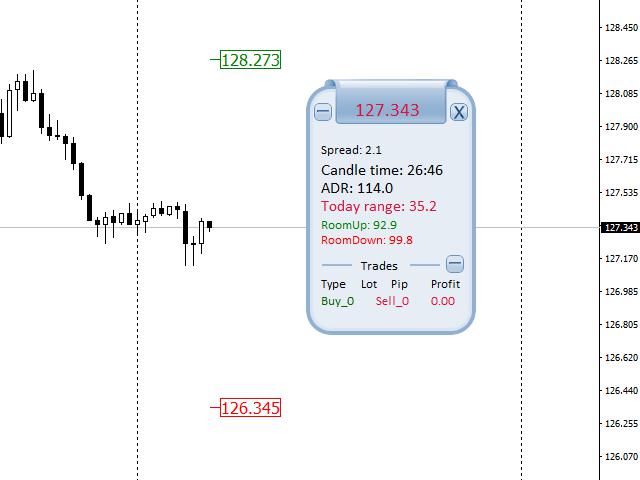
La primera parte del panel:
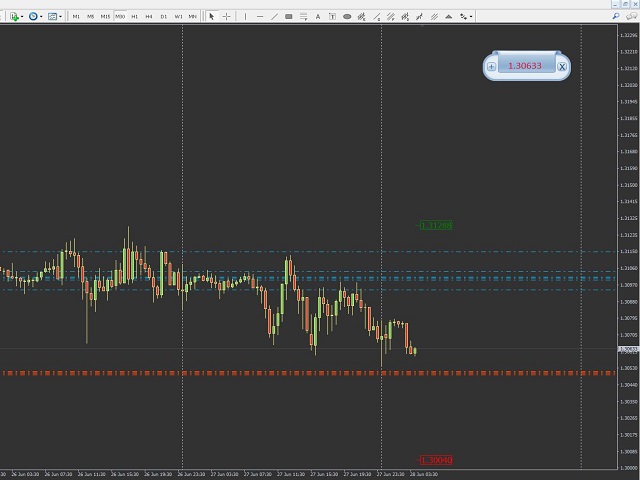
- Precio: El color cambia según el nivel de apertura diaria. El precio por encima de la apertura, el color es,:DarkGreen. El precio por debajo de la apertura, el color es: Carmesí. Puede contraer el panel para ver sólo esta información.
La segunda parte del panel: Los datos diarios.
- Spread: El spread actual según tu broker.
- Tiempo de la vela: El tiempo restante de la vela del marco temporal actual.
- ADR: El rango medio diario.
- Rango actual: el rango real en el que se ha movido el mercado en el día de negociación actual. El color cambia según el nivel de apertura diaria. Si el precio está por encima de la apertura, el color es verde oscuro. El precio por debajo de la apertura, el color es: Carmesí.
- Subida de Pips: Muestra el número de pips que el mercado necesita moverse hacia ARRIBA, para alcanzar el nivel superior ADR. En el gráfico una pequeña etiqueta muestra el nivel de precio actual para este dato. Mira por encima del precio actual. En el menú del indicador puede elegir no ver la etiqueta en el gráfico.
- RoomDown: Muestra el número de pips que el mercado necesita para moverse hacia abajo, para alcanzar el nivel inferior ADR. En el gráfico una pequeña etiqueta muestra el nivel de precio actual para este dato. Mire debajo del precio actual. En el menú del indicador puede elegir no ver la etiqueta en el gráfico.
Una vez que se alcanza el nivel ADR en un día de negociación actual, tanto las etiquetas del gráfico como las líneas "RoomUp" y "RoomDown" del panel cambian de color y se vuelven neutras/grises.
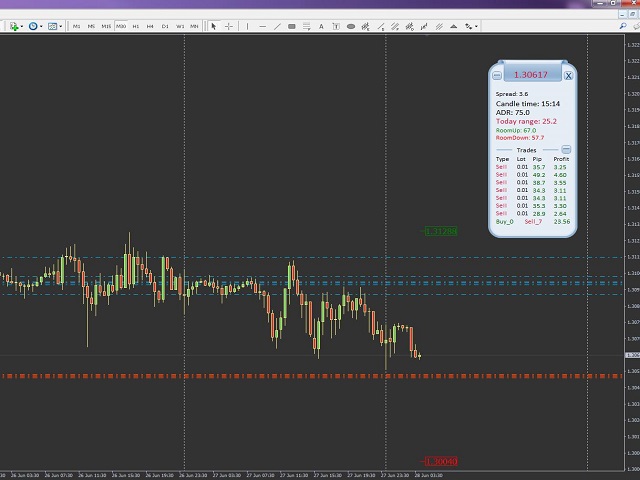
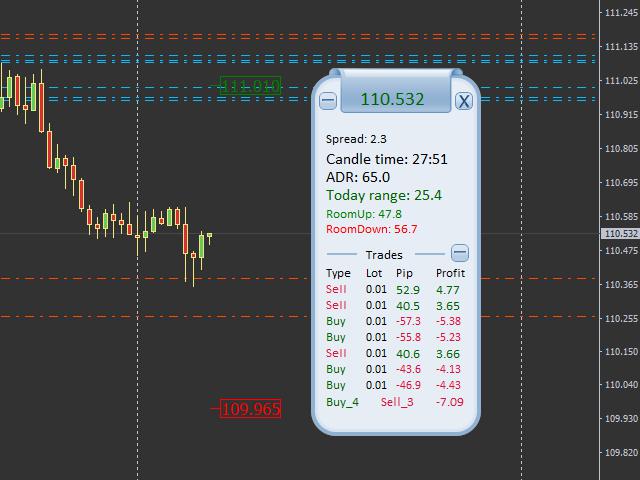
La tercera parte del panel: Operaciones
- Puede contraer esta sección para hacer el panel más pequeño.
- Aquí puede ver las operaciones abiertas actualmente, ordenadas por la hora de apertura: La más antigua es la primera y así sucesivamente.
- Puede ver el tipo de operación: VENTA es de color carmesí y COMPRA es de color verde oscuro.
- Puede ver en cada operación, cuántos lotes está negociando.
- Puede ver los pips de cada operación: Los pips negativos son de color carmesí, los pips positivos son de color verde oscuro.
- Puedes ver el beneficio: Esto es de acuerdo a la moneda base de su cuenta de broker. También los mismos colores que antes para las cantidades negativas / pérdidas, o positivas / ganancias.
- La última línea es el resumen: Usted puede ver el total de sus operaciones: Cuántas COMPRAS y cuántas VENTAS están abiertas, y la ganancia/pérdida actual de todas las operaciones abiertas en el gráfico. No hay cantidades de pips en la línea de resumen.
Cada sección se puede contraer o expandir con los botones "+" o "-".
Nota: No puede ser probado. El color de fondo del panel principal no es editable.
Configuración
- Dibujar habitaciones: true / false. Aquí es donde puede elegir tener las etiquetas ADR en el gráfico principal, por encima y por debajo del precio.
- Color de lalínea RoomUp: El color de la etiqueta superior.
- Color de lalínea RoomDown: El color de la etiqueta inferior.
- Color neutro dela sala: Una vez que se alcanza el rango ADR, las etiquetas cambian a este color.
- Room label size: tamaño de la etiqueta en el gráfico.