Fibonacci Pyramid
- Indicadores
- Versión: 1.2
- Activaciones: 5

Este indicador dibuja el nivel de Fibonacci automáticamente desde el máximo más alto al mínimo más bajo o desde el mínimo más bajo al máximo más alto combinándolo con la Estrategia de Trading Piramidal para una mejor relación riesgo-recompensa. Con rango Fibonacci ajustable y tiene una función de alerta.
¿Qué es la estrategia Pyramid Trading?
El concepto básico de la pirámide en una posición es que se agrega a la posición como el mercado se mueve a su favor. Su stop loss se mueve hacia arriba o hacia abajo (dependiendo de la dirección del comercio, por supuesto) para bloquear las posiciones. Así es como usted mantiene su riesgo total mientras aumenta el tamaño de su posición en la operación.
Ventajas de la estrategia de trading piramidal:
- El único riesgo en las múltiples operaciones que toma es el riesgo en la operación actual, porque el resto de las operaciones deben tener sus trailing stops movidos para bloquear posiciones.
Desventajas de la Estrategia de Trading Piramidal:
- No puede aplicar la estrategia piramidal a todas las operaciones, ya que a veces su sistema de trading puede dar una sola señal o la dirección de la tendencia puede cambiar.
- Algunos operadores de Forex tienden a mover su stop loss (aumentar la distancia del stop loss... incrementando así su riesgo) cuando ven que el precio se dirige en la otra dirección para casi eliminar su stop loss. No lo haga. La única pérdida que debe sufrir es la pérdida de la operación más reciente....todas las demás operaciones, cuando se alcanza el trailing stop loss.
Cómo utilizar la estrategia de negociación de la pirámide de Fibonacci
Los operadores de Forex utilizan la pirámide de Fibonacci para determinar dónde colocar las órdenes de entrada en el mercado, de recogida de beneficios y de stop-loss. Los niveles de Fibonacci se utilizan comúnmente en el comercio de divisas para identificar y operar a partir de los niveles de soporte y resistencia.
Los retrocesos de Fibonacci identifican niveles clave de soporte y resistencia. Los niveles de Fibonacci suelen calcularse después de que un mercado haya realizado un gran movimiento, ya sea al alza o a la baja, y parezca haberse aplanado en un determinado nivel de precios. Los operadores trazan los niveles clave de retroceso de Fibonacci del 38,2%, 50% y 61,8% trazando líneas horizontales a través de un gráfico en esos niveles de precios para identificar las zonas en las que el mercado puede retroceder antes de reanudar la tendencia general formada por el gran movimiento inicial de los precios. Los niveles de Fibonacci se consideran especialmente importantes cuando un mercado se ha acercado o ha alcanzado un nivel importante de soporte o resistencia de precios.
En realidad, el nivel del 50% no forma parte de la secuencia de números de Fibonacci, pero se incluye debido a la experiencia generalizada en el comercio de un mercado que retrocede aproximadamente la mitad de un movimiento importante antes de reanudar y continuar su tendencia.
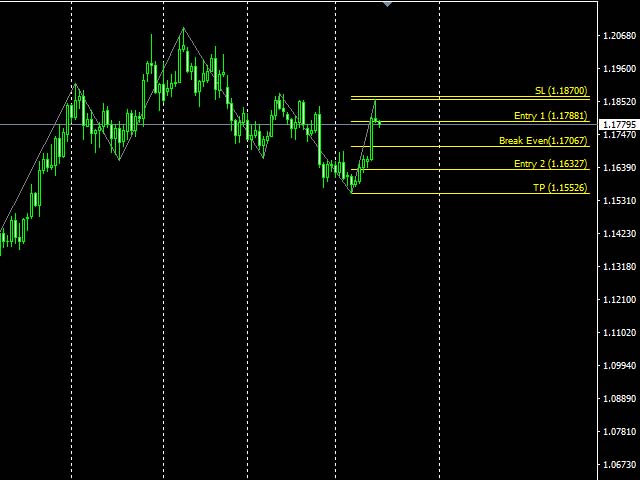
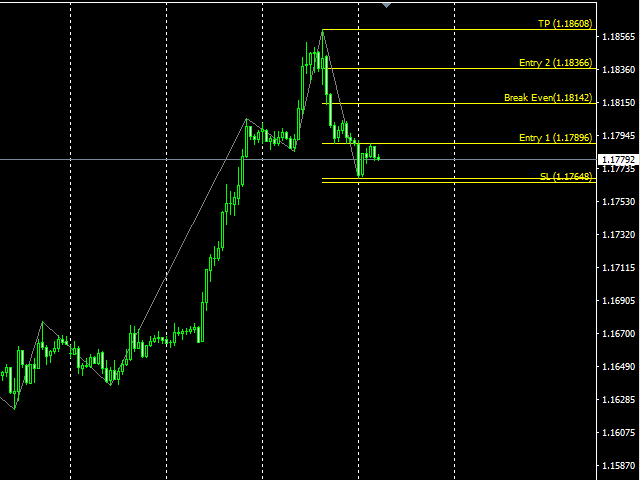
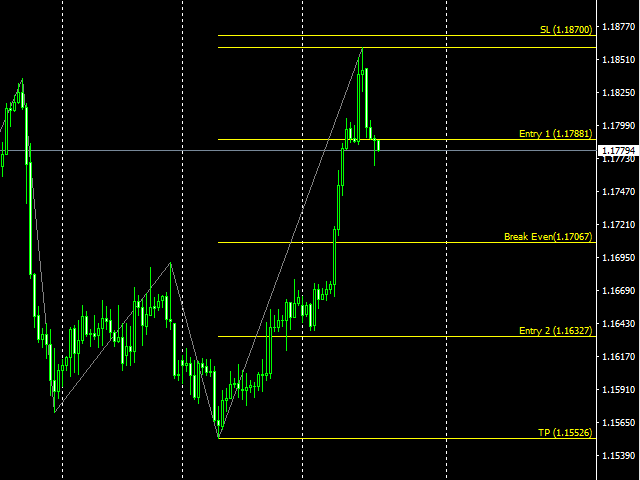
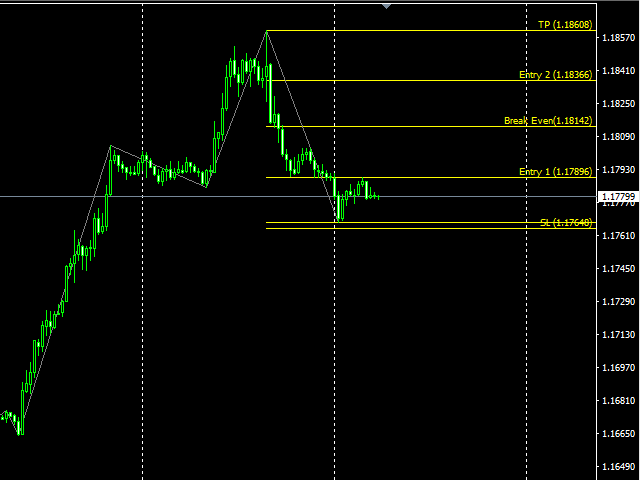
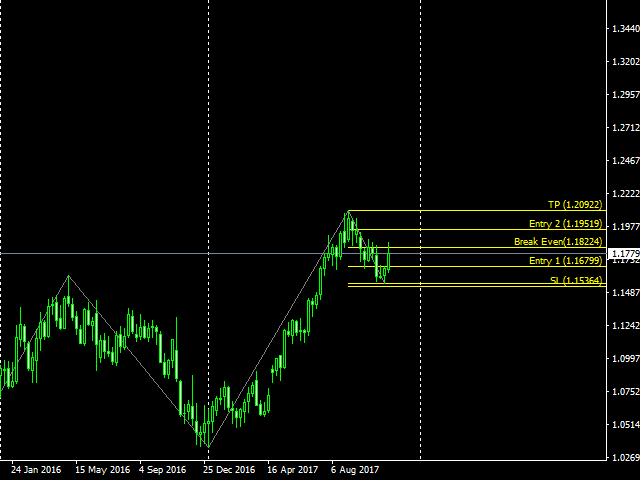
Cómo operar utilizando los niveles de la pirámide de Fibonacci
- Orden de entrada (compra/venta) en el nivel de retroceso de entrada 1 con una orden de stop-loss colocada en SL (puede ajustarse manualmente según sus pips de diferencial).
- Segunda entrada para la pirámide en la Entrada 2 con el mismo lote que la entrada 1 o el doble de su lote, ponga toda su orden de stop-loss en Break Even, y mueva el stop-loss de la entrada 1 (trailing) al nivel de Break Even (Ahora todos los Stop-loss en el nivel de Break Even).
- Toma de beneficios Entrada 1 y Entrada 2 en el nivel TP.
- Cuide su riesgo entre 2%-4% en cada operación.
Parámetros
- Profundidad - desplazamiento = barras contadas - profundidad (por defecto 12).
- Desviación - desviación del precio superior/inferior (por defecto 5).
- Backstep - mostrar los puntos de entrada en la historia en el gráfico para el análisis visual.
- Alerta - activar/desactivar alertas push cuando el precio toca el área de Fibo.