Dashboard MACD MT5
- Indicadores
-
Wang Yu
 Providing quick Developments and Conversion of MT4/MT5 EAs, Indicators, Scripts, and Tools. If you are looking for an Dashboard EA to turn your trading strategy into auto trading algo and to manage multi trades in one chart with visualizing tool, come and visit http://www.ex4gzs.com/en for more
 - Versión: 1.1
- Actualizado: 25 noviembre 2021
- Activaciones: 5
Este indicador ayuda a visualizar el estado MACD de 28 pares. Con la función de panel de color, alerta, y las características de notificación, el usuario puede captar las oportunidades potenciales de compra y venta cuando los 28 principales pares de EMA rápida cruzan la EMA lenta en un tablero de instrumentos rápidamente.
Dashboard MACD es una herramienta gráfica intuitiva y práctica que le ayudará a monitorizar los 28 pares y proporcionar señales de trading basadas en las reglas MACD (Fast EMA Cross Slow).
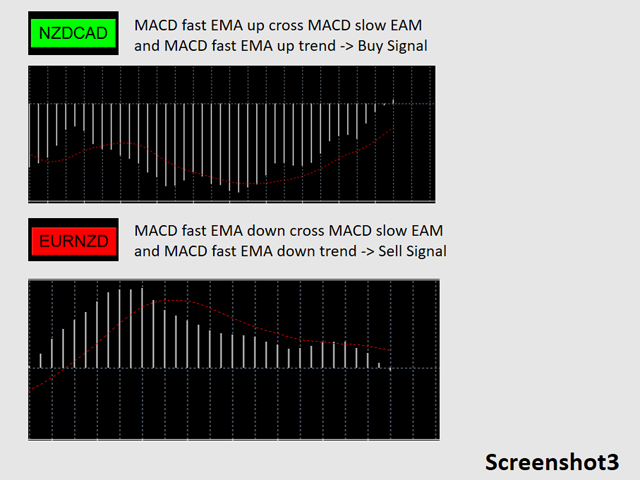
Leyenda de colores
- clrRojo: MACD fast EMA down cross MACD slow EAM y MACD fast EMA down trend
- Se envía señal de venta
- clrLima: MACD fast EMA up cross MACD slow EAM y MACD fast EMA up trend
- Se envía señal de compra
Consulte la captura de pantalla 3
Acciones importantes antes de utilizar el panel de control
- La primera vez que cargue el panel, la descarga de los datos históricos puede tardar entre 3 y 5 minutos. Para cargas posteriores, sólo tarda unos segundos.
- Asegúrese de que tiene los 28 símbolos en la ventana Símbolo.
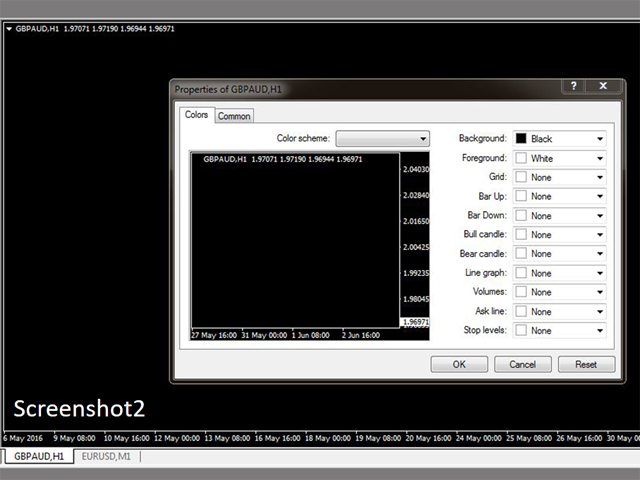
- Para que su cuadro de mandos tenga un aspecto claro y ordenado, es mejor aplicar la plantilla negra. Consulte la captura de pantalla 2.
Parámetros de entrada
- Enviar Alerta tras Señal
- Enviar Notificación en caso de Señal
- TimeFrame del MACD
- Periodo Rápido de MACD
- Periodo lento de MACD
- Periodo de señal de MACD
- Precio aplicado de MACD
- TimeFrame del nuevo gráfico
- string usertemplate = "default"
- sufijo: cadena de sufijo de su símbolo. es decir: su símbolo es 'EURUSDx' en lugar de 'EURUSD', introduzca 'x' en la celda de sufijo, deje la celda de prefijo en blanco
- prefijo: cadena del prefijo de su símbolo
- eje_x: posición x del cuadro de mandos
- eje_y: posición y del cuadro de mandos
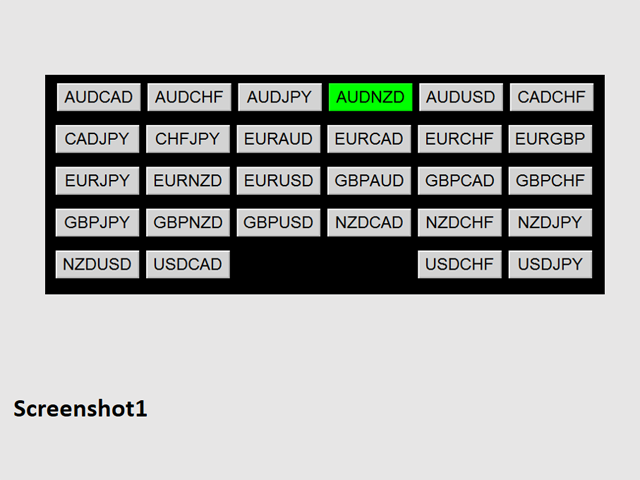
Objetos del cuadro de mandos
Consulte las capturas de pantalla 1 y 3.
Notas
Una vez enviada la alerta/notificación de un par concreto, la siguiente alerta/notificación de ese par se enviará durante los 5 minutos siguientes a la señal.