Price Momentum Alerts
- Indicadores
- Versión: 1.0
- Activaciones: 15

Introducción
En el vertiginoso mundo de la negociación en los mercados financieros, el éxito depende a menudo de la capacidad de detectar y aprovechar las tendencias. Entre las diversas estrategias disponibles, el momentum se destaca como una herramienta poderosa para los operadores que buscan capitalizar los movimientos del mercado. En este artículo, profundizaremos en el concepto de impulso, su importancia en las operaciones y las numerosas ventajas que ofrece a los operadores.
¿Qué es el impulso?
El impulso en el comercio se refiere a la tendencia de los activos a continuar moviéndose en su dirección actual. Se trata de la idea de que los activos que han obtenido buenos resultados probablemente seguirán haciéndolo, mientras que los que se encuentran en una trayectoria descendente probablemente seguirán bajando. Los operadores que utilizan estrategias de impulso pretenden aprovechar estas olas, comprando activos con buenos resultados y vendiendo o vendiendo en corto activos con malos resultados.
¿Por qué es importante el impulso?
El impulso es crucial en las operaciones de los mercados financieros por varias razones:
-
Evidencia histórica: Numerosos estudios han demostrado que las acciones, las divisas, las materias primas, los índices y otros activos financieros muestran impulso. En otras palabras, los activos que han obtenido buenos resultados en el pasado reciente suelen seguir haciéndolo en el futuro próximo. Estas pruebas empíricas proporcionan una base sólida para las estrategias de negociación con impulso.
-
Factores psicológicos: Los participantes en el mercado suelen reaccionar a los movimientos recientes de los precios. Las noticias positivas pueden crear un "efecto bandwagon", atrayendo a más compradores, mientras que las noticias negativas pueden desencadenar ventas de pánico. Los operadores de Momentum aprovechan estas respuestas emocionales del mercado.
-
Diversificación: las operaciones de impulso pueden complementar otras estrategias de negociación en una cartera diversificada. Al incluir operaciones basadas en el impulso, los operadores pueden reducir el riesgo y aumentar sus posibilidades de beneficiarse de los movimientos del mercado.
Ventajas de operar con impulso
Operar con impulso ofrece varias ventajas a los operadores:
-
Potencial de beneficios: Las estrategias de impulso tienen el potencial de generar importantes beneficios cuando se aplican correctamente. Al identificar y aprovechar las tendencias, los operadores pueden captar movimientos de precios sustanciales.
-
Reducción del riesgo: Los operadores de Momentum suelen utilizar órdenes stop-loss y otras técnicas de gestión del riesgo para limitar las pérdidas potenciales. Este enfoque de mitigación del riesgo puede ayudar a proteger el capital en mercados volátiles.
-
Simplicidad: Las operaciones de impulso son relativamente sencillas. Los operadores no necesitan analizar complejos estados financieros o indicadores económicos. En su lugar, se centran en la evolución de los precios y en los resultados recientes.
-
Adaptabilidad: Las estrategias de impulso pueden aplicarse a diversas clases de activos, como acciones, materias primas y divisas. Esta versatilidad permite a los operadores explorar diferentes mercados y diversificar sus carteras.
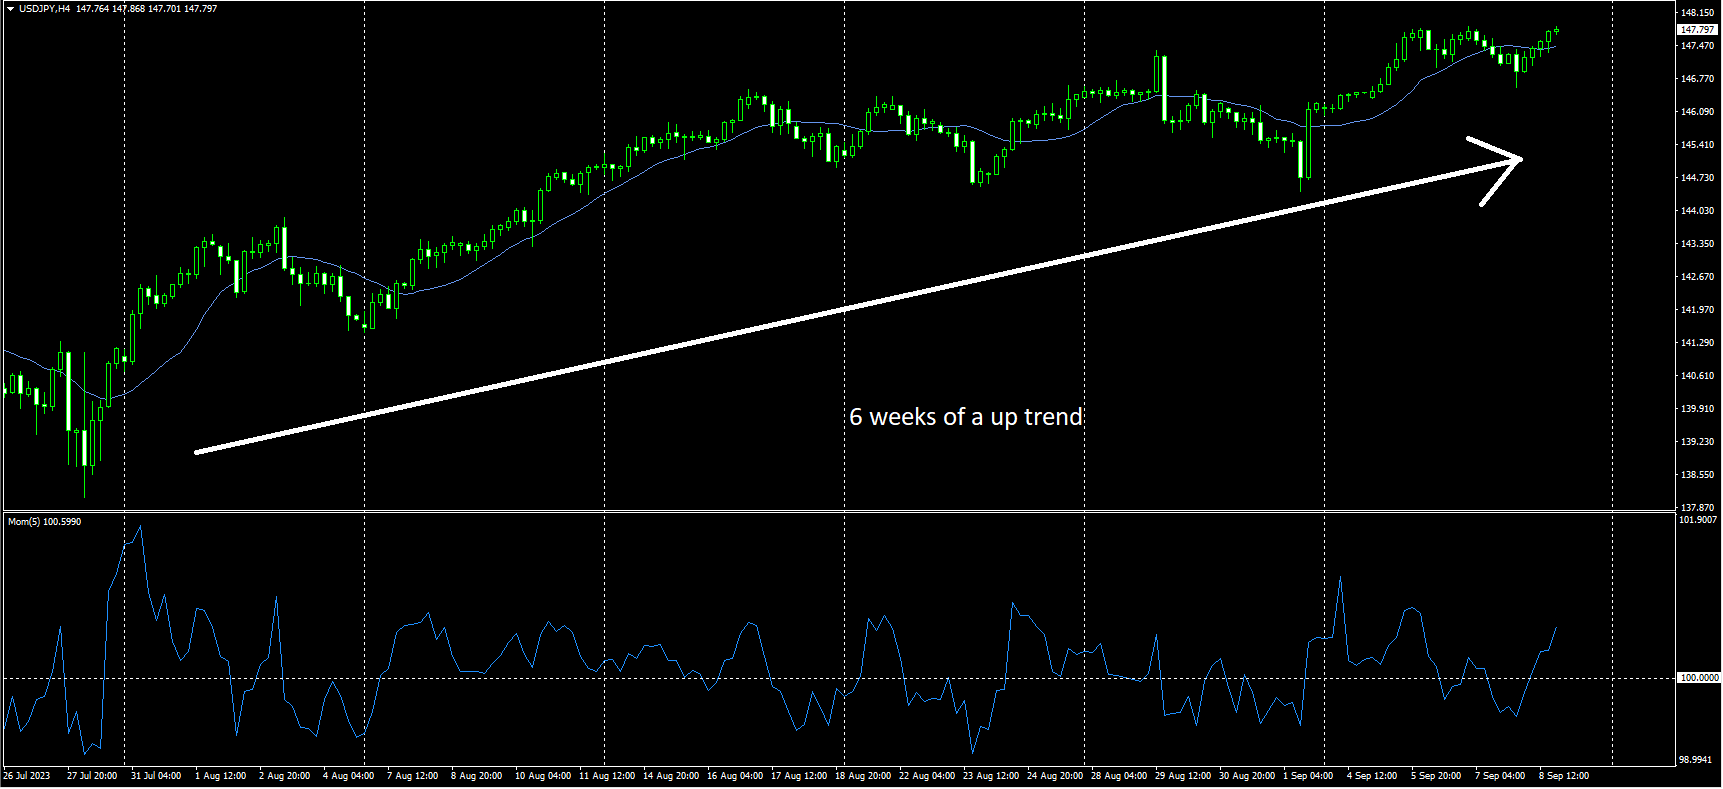
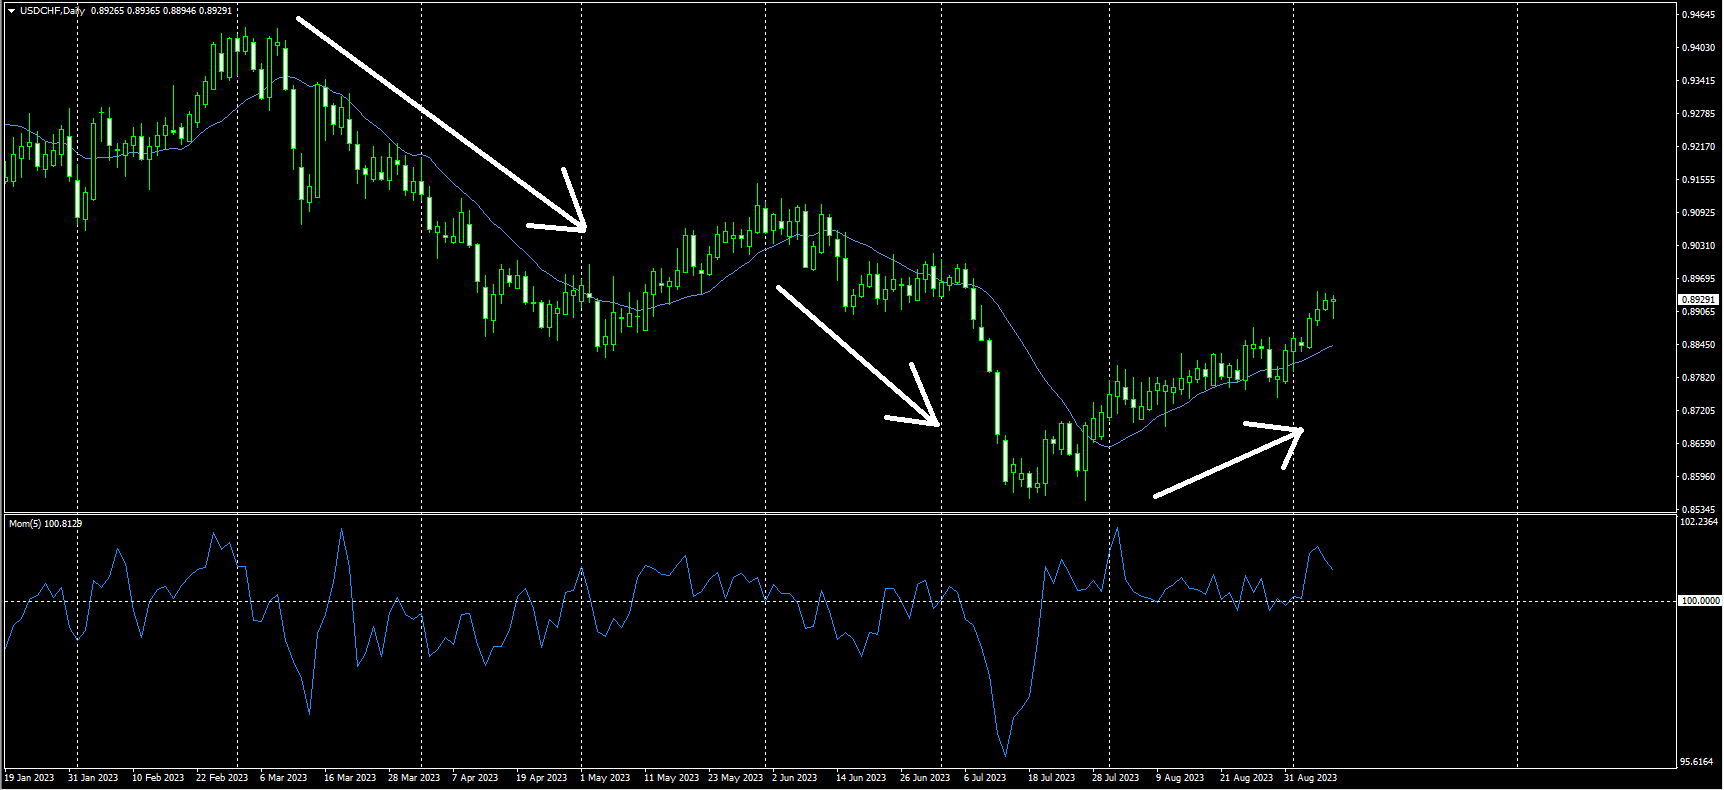
Operar con la tendencia y el impulso
Las operaciones con impulso suelen ir de la mano de las operaciones con tendencia. Los operadores que siguen la tendencia buscan activos que se muevan en una dirección clara y alinean sus operaciones en consecuencia. Por otro lado, los operadores de impulso buscan específicamente activos con un fuerte rendimiento reciente, que a menudo se corresponde con activos de un mercado en tendencia.
Combinando estos dos enfoques, los operadores pueden aumentar sus probabilidades de éxito. Cuando un activo muestra un fuerte impulso y sigue una tendencia bien definida, se presenta una oportunidad atractiva para que los operadores se beneficien del movimiento continuado del precio en la misma dirección.
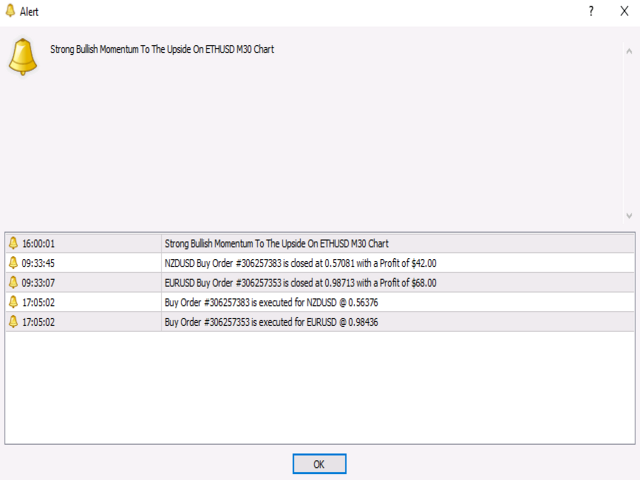
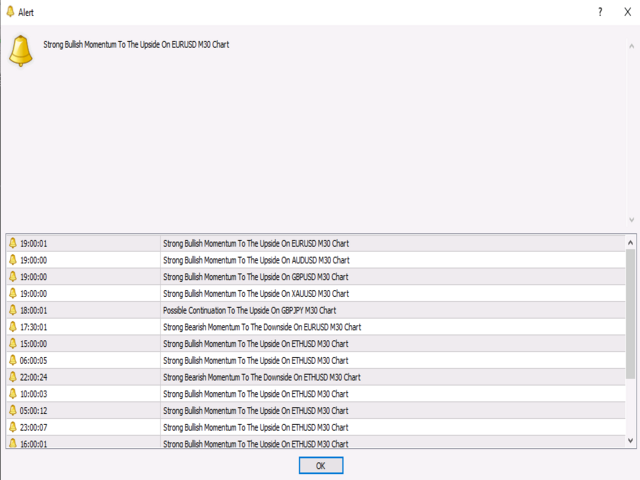
Ventajas de las alertas de impulso del precio
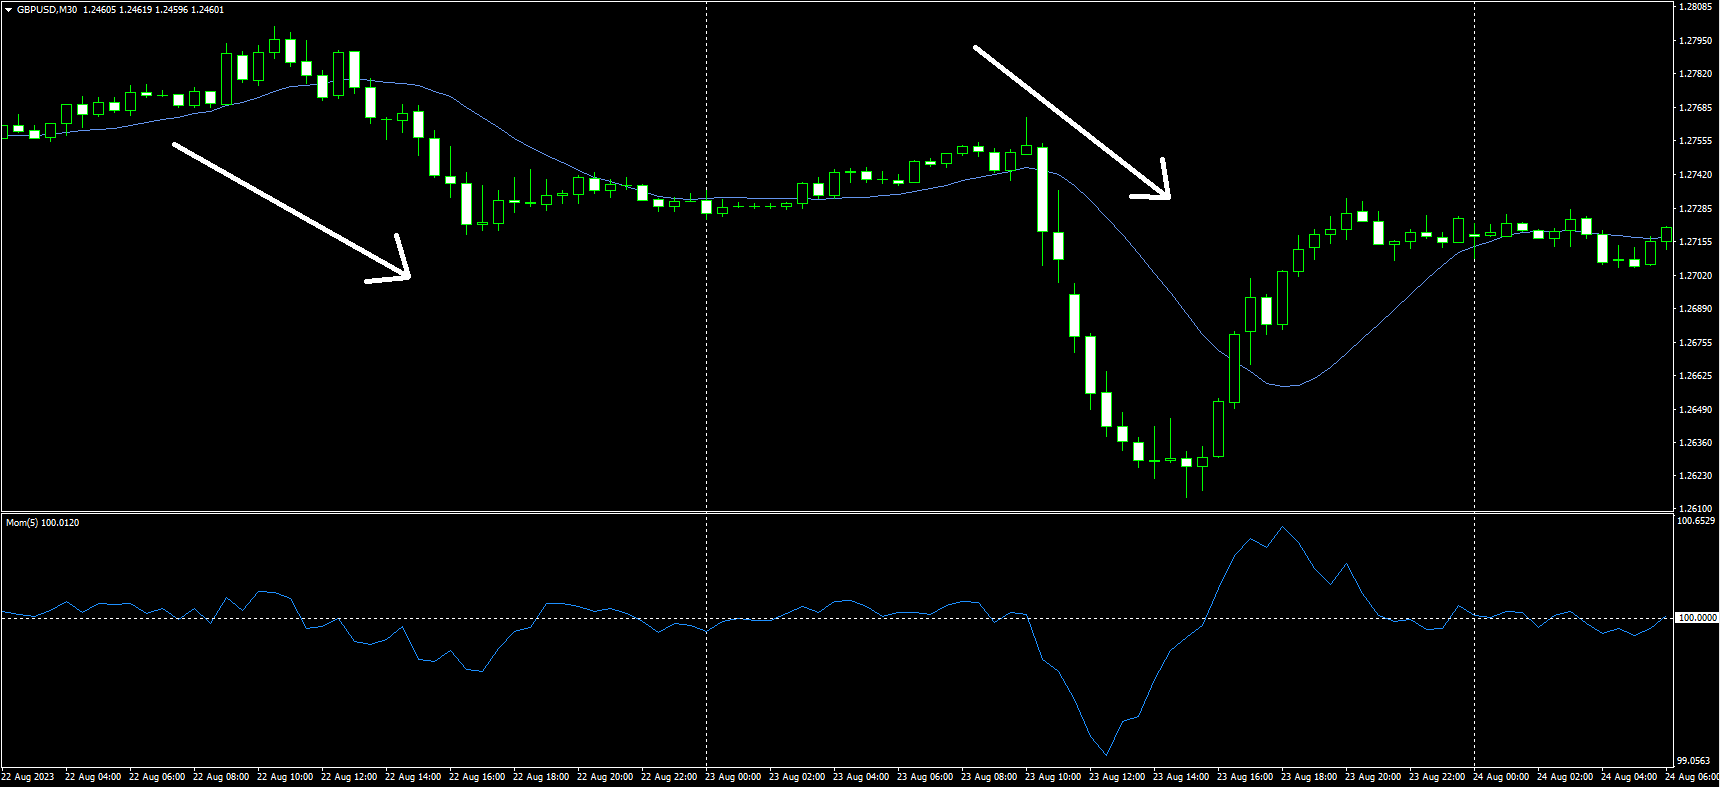
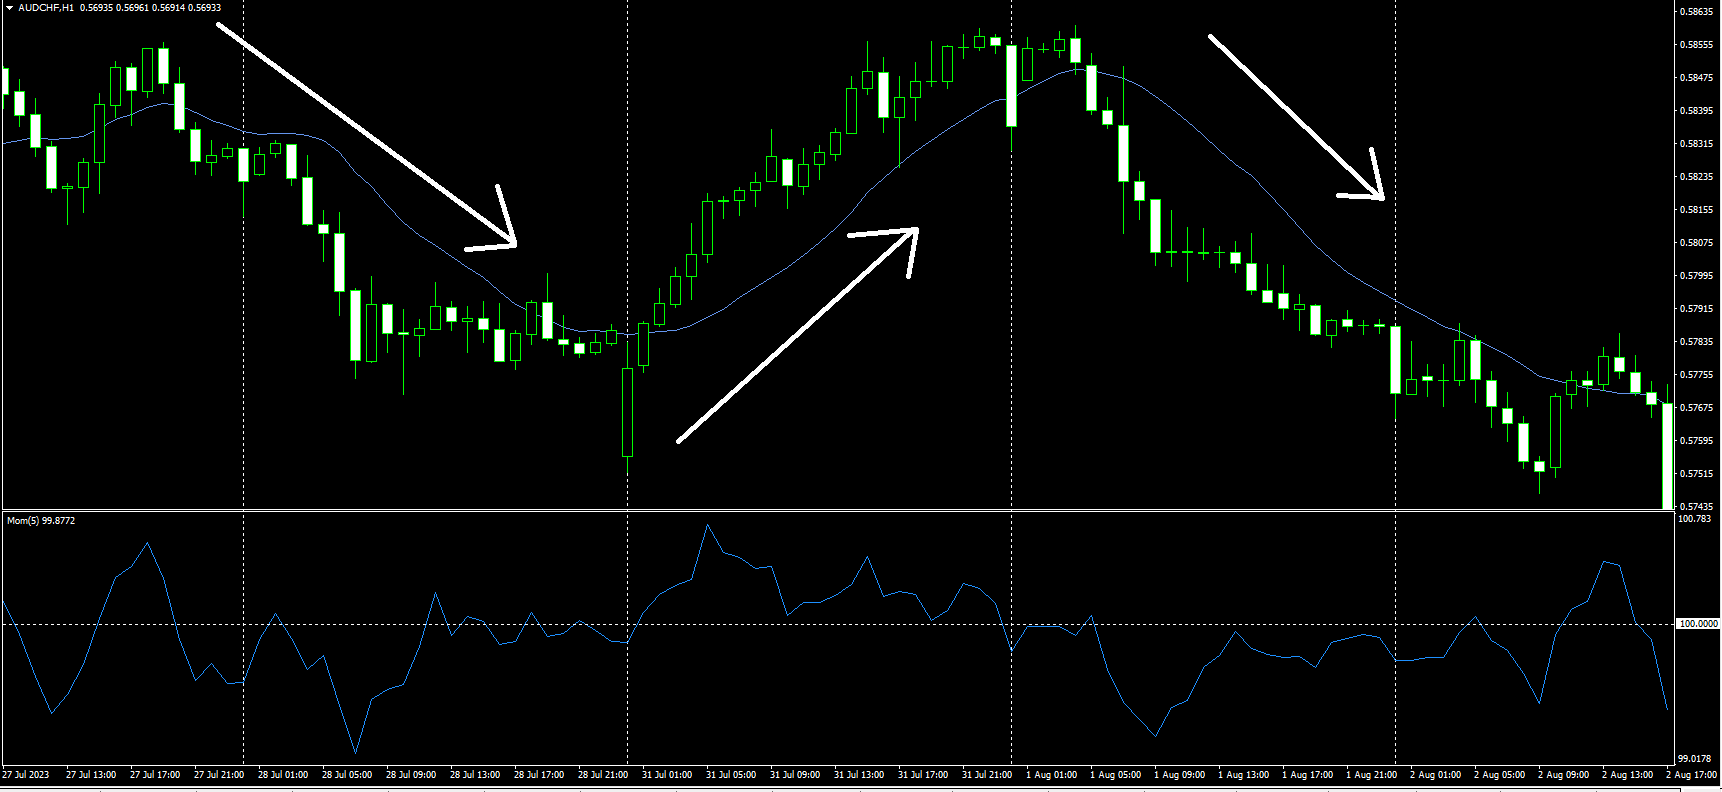
Recibirá alertas cuando el precio se disponga a moverse con fuerza al alza o a la baja.
Puede combinar estas alertas con su propio análisis. (Esto es muy recomendable.)
Este indicador se puede utilizar en cualquier par de divisas, incluyendo criptomonedas, índices, oro, y más.
Este indicador se puede utilizar en cualquier marco de tiempo. Desde el gráfico de un minuto hasta el gráfico mensual.
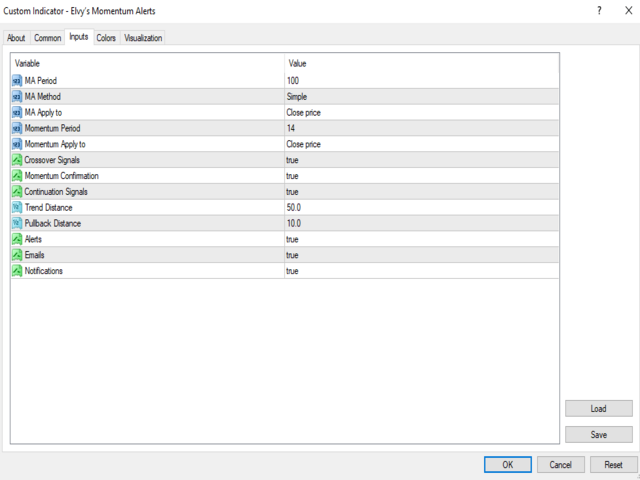
En la configuración, puede cambiar fácilmente el período de media móvil y el período de impulso. También puede optar por utilizar medias móviles ponderadas simples, suavizadas, exponenciales o lineales.
Este indicador se puede utilizar en múltiples gráficos y múltiples marcos temporales a la vez. Para alertas de 24 horas durante todo el día, utilice un VPS. (Servidor Privado Virtual )
Configuración recomendada:
Se recomienda que utilice este indicador en el marco de tiempo M30 y superior. Me parece que usted puede obtener grandes resultados utilizando en el marco de tiempo M30 en cualquier par de divisas, índices, oro, y crypto. Hay momentos en los que puede obtener buenas alertas en el gráfico M15, pero todo depende de su estilo de negociación. Si usted está operando el día, utilice los marcos de tiempo más pequeños, como M15 y M30. Yo diría que puede ir tan bajo como el M5.
También le recomiendo que añada una media móvil a sus gráficos como referencia visual. Este indicador no tiene ningún visual. Sólo recibirá alertas sobre el impulso alcista o bajista basado en la acción del precio. Incluso si no traza una media móvil en su gráfico, necesitará utilizar una en la configuración del indicador para que funcione. La elección de una media móvil depende de su estilo de negociación. Para un gráfico M30, utilice una media móvil de 8 hasta una media móvil de 25. Para los gráficos H4 y D1, utilice una media móvil de 50 hasta una media móvil de 100.
Tenga en cuenta que cuanto más alto sea el marco temporal que utilice y cuanto más grandes sean las medias móviles que utilice, más tiempo tardará en recibir una alerta.
Para el periodo de impulso, recomiendo utilizar de 5 a 15. Puede utilizar números mayores si lo desea. Puede utilizar números más grandes si lo desea. Mantenga las medias móviles y el periodo de impulso como (CERRADO). Mantenga las señales de cruce como (TRUE) y las señales de impulso como (TRUE). Para las señales de continuación, puede mantenerlas como verdaderas o falsas. Usted decide. Las señales de continuación le darán una alerta basada en cuánto se aleja el precio de la media móvil, la distancia de tendencia y la distancia de retroceso que elija en la configuración. Usted verá esta opción en la configuración. Yo diría que probar diferentes números para la media móvil y el período de impulso y ver lo que funciona mejor para su estilo de negociación.
Cuando reciba una alerta de impulso, asegúrese de mirar bien los niveles de soporte y resistencia. Lo mejor es tomar operaciones de compra que estén más cerca de los niveles de soporte y operaciones de venta que estén más cerca de los niveles de resistencia. Es común recibir una alerta y que el precio retroceda o retroceda un poco antes de continuar en la dirección de la alerta. Por lo tanto, tenga esto en cuenta. Utilice este indicador como una guía, no como la única razón para entrar en una operación. Este indicador está diseñado para ayudarle a encontrar el impulso en los mercados. Asegúrese de utilizar este indicador en conjunción con su estrategia de negociación o análisis.
Le deseo lo mejor. Por favor, envíeme un mensaje si tiene alguna pregunta.
Saludos cordiales,
Danny