Colored Candles Demo
- Indicadores
-
Alexander Nikolaev
 I develop Expert Advisors, program in MQL4 and MQL5. I've been programming for a long time, I know C ++ and other languages.
Recommended advisors: - Versión: 1.1
- Actualizado: 28 noviembre 2021
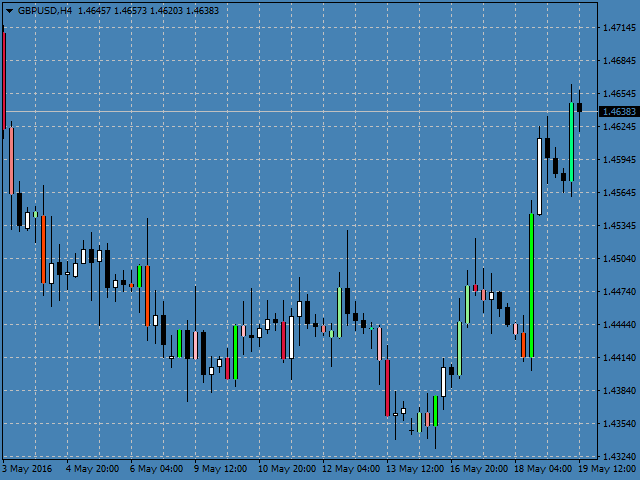
La versión demo del indicador Colored Candles - calcula los parámetros de cada vela, así como su volumen. Después de eso, pinta las velas en función de su fuerza y dirección. Las velas alcistas se colorean de verde y las bajistas de rojo. Cuanto mayor sea la fuerza de los toros o los osos, más brillante será el color. Puede cambiar los colores si lo desea. El indicador ayuda a analizar el movimiento del precio, así como los puntos de entrada en el mercado. Las señales más precisas se forman en los plazos más altos. Es posible y deseable utilizarlo junto con otros indicadores MetaTrader.
Esta es una versión demo del indicador, y sólo funciona en el marco de tiempo H4. Para trabajar en todos los marcos de tiempo, comprar la versión completa:
https://www.mql5.com/en/market/product/16268
Parámetros
- Historia - el número de barras de historia para analizar y pintar;
- Minimum length candle - la longitud mínima de la vela analizada;
- PeriodADX - período del indicador ADX;
- ADX y relación alto-bajo - relación del indicador ADX y la longitud mínima de la vela;
- CountCandlesVolume - número de velas para comparar el volumen (si se establece en 0, el volumen de la vela no se analiza);
- ColorBuy1 - color de las velas alcistas débiles;
- ColorBuy2 - color de las velas alcistas de fuerza media;
- ColorBuy3 - color de las velas alcistas fuertes;
- ColorBuy4 - color de las velas alcistas más fuertes;
- ColorSell1 - color de las velas bajistas débiles;
- ColorSell2 - color de las velas bajistas de fuerza media;
- ColorSell3 - color de las velas bajistas fuertes;
- ColorSell4 - color de las velas bajistas más fuertes;
- CandlesWidth - anchura del cuadro de velas.


El usuario no ha dejado ningún comentario para su valoración