PipTick Pairs Spread MT4
- Indicadores
-
Michal Jurnik
 "Talent is cheaper than table salt. What separates the talented individual from the successful one is a lot of hard work." - Stephen King. Those few words reflect myself very well. I am probably not the most talented developer in the world but I truly believe in hard work, professional attitude and
 - Versión: 1.6
- Actualizado: 28 junio 2024
- Activaciones: 5
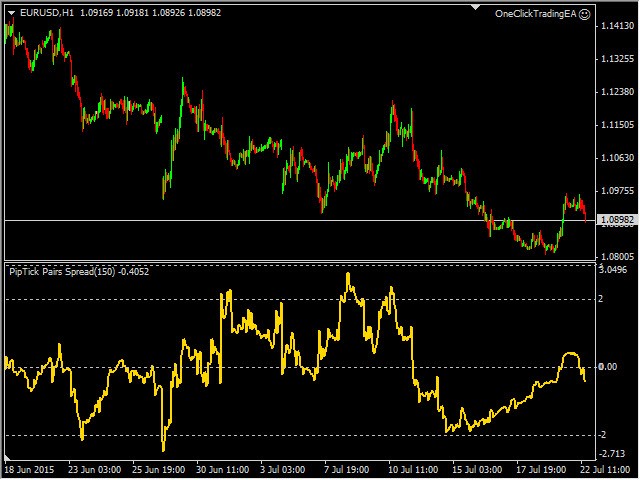
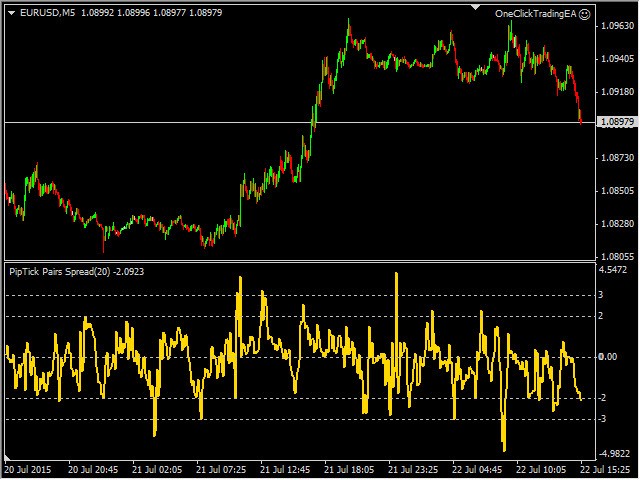
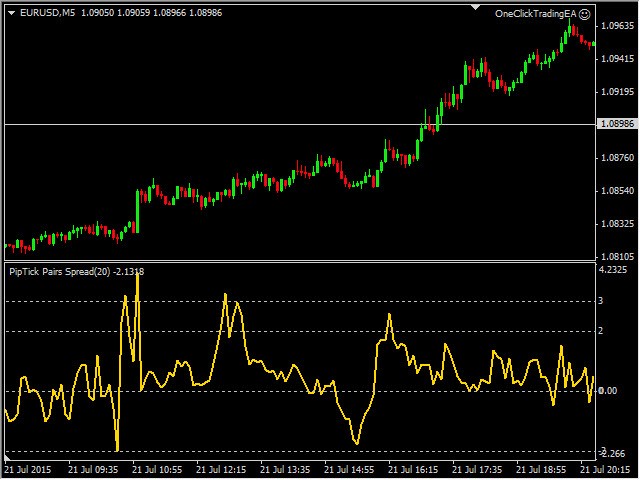
El indicador Pairs Spread se ha desarrollado para la popular estrategia conocida como negociación de pares, negociación de diferenciales o arbitraje estadístico. Este indicador mide la distancia (spread) entre los precios de dos instrumentos correlacionados directamente (positivamente) y muestra el resultado como una curva con desviaciones estándar. De este modo, los operadores pueden identificar rápidamente cuándo los instrumentos están demasiado alejados y utilizar esta información para buscar oportunidades de negociación.
Cómo utilizar el indicador Pairs Spread
Los mejores resultados se obtienen cuando la operación se abre entre la segunda y la tercera desviación típica.
- El indicador se encuentra entre la 2ª y la 3ª desviación típica - VENTA Par 1, COMPRA Par 2.
- El indicador se encuentra entre la 2ª y la 3ª desviación típica - COMPRA Par 1, VENTA Par 2.
Pares de divisas adecuados
- EURUSD vs. GBPUSD
- EURUSD vs. NZDUSD
- USDCHF vs. USDJPY
- AUDUSD vs GBPUSD
- AUDUSD vs. EURUSD
Características principales
- El indicador muestra las desviaciones del estado normal.
- Una simple comparación de la correlación real entre dos pares de divisas.
- La segunda y tercera desviaciones estándar de la zona para entrar en los oficios.
- Funciona en todos los marcos temporales (M1, M5, M15, M30, H1, H4, D1, W1, MN).
- El indicador no repinta.
- Listo para backtesting (periodo de retrospectiva personalizable).
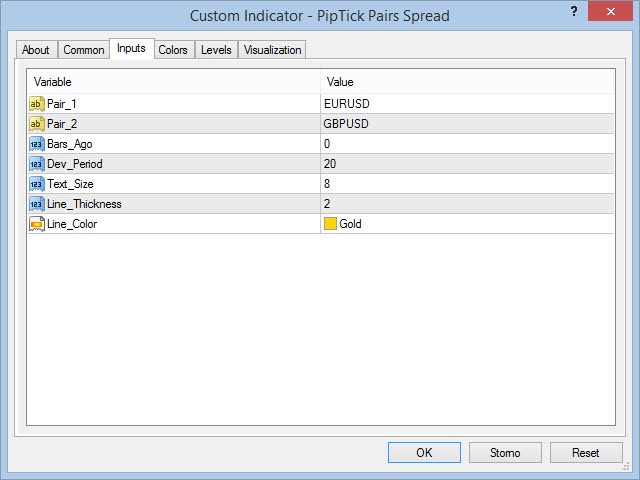
- Parámetros personalizables (colores, grosor de línea, periodo de desviación...).
- Alta velocidad de cálculo.
- El indicador funciona también con prefijos y sufijos de símbolos (EURUSD.m, EURUSD-pro...).
- Disponible para MT4 y MT5.
Por favor, visite la página de productodel indicadorPairs Spread para la configuración de los parámetros de entrada y salida.

I echo the same problem with product as those in comment section in there was no output at all for any pairs. I the buyer spent many days trying to work with seller to resolve the issue, rather than just simply admitting error, seller refused come to an agreeable satisfactory solution. I was told to wait on the product to be ready for testing, meanwhile I have a product that can't be used and days are counting down as the product is rented. A much, much better product is called 'hedge pair' and can be found via a simple search on here. Seller of that product is extremely easy to work with and very accommodating, unfortunately unlike Mr. Jurnik. Everyone, please be careful and avoid this seller. Everyone, be safe and thanks.