Levels for MT4 by OptionClue
- Indicadores
- Versión: 2.3
- Activaciones: 5

El indicador Niveles se ha creado para simplificar el proceso de trazado de niveles y zonas de soporte y resistencia en los marcos temporales seleccionados. El indicador traza los niveles más cercanos de los marcos temporales seleccionados, que se resaltan en diferentes colores. Esto reduce significativamente el tiempo necesario para trazarlos en el gráfico y simplifica el proceso de análisis del mercado.
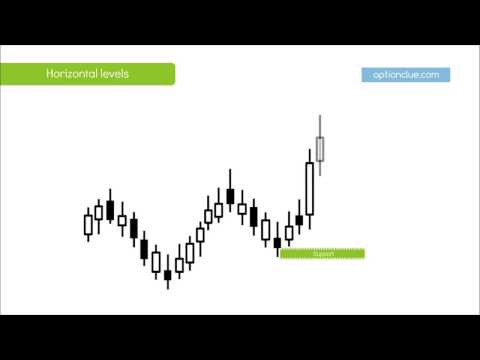
Los niveles horizontales de soporte y resistencia se utilizan para identificar las zonas de precios en las que el movimiento del mercado puede ralentizarse o en las que es probable que se produzca una inversión del precio. El indicador Niveles ayuda a identificar las señales óptimas de entrada y salida que aparecen durante una corrección profunda del mercado, o a calcular el stop loss y el take profit.
El indicador Niveles traza niveles de soporte y resistencia basados en patrones de precios que se producen en puntos locales de inversión de precios en el gráfico. Son universales y pueden utilizarse sin ajustarse a datos históricos. Actualmente, el indicador Niveles incluye 28 patrones de precios que se complementan entre sí.
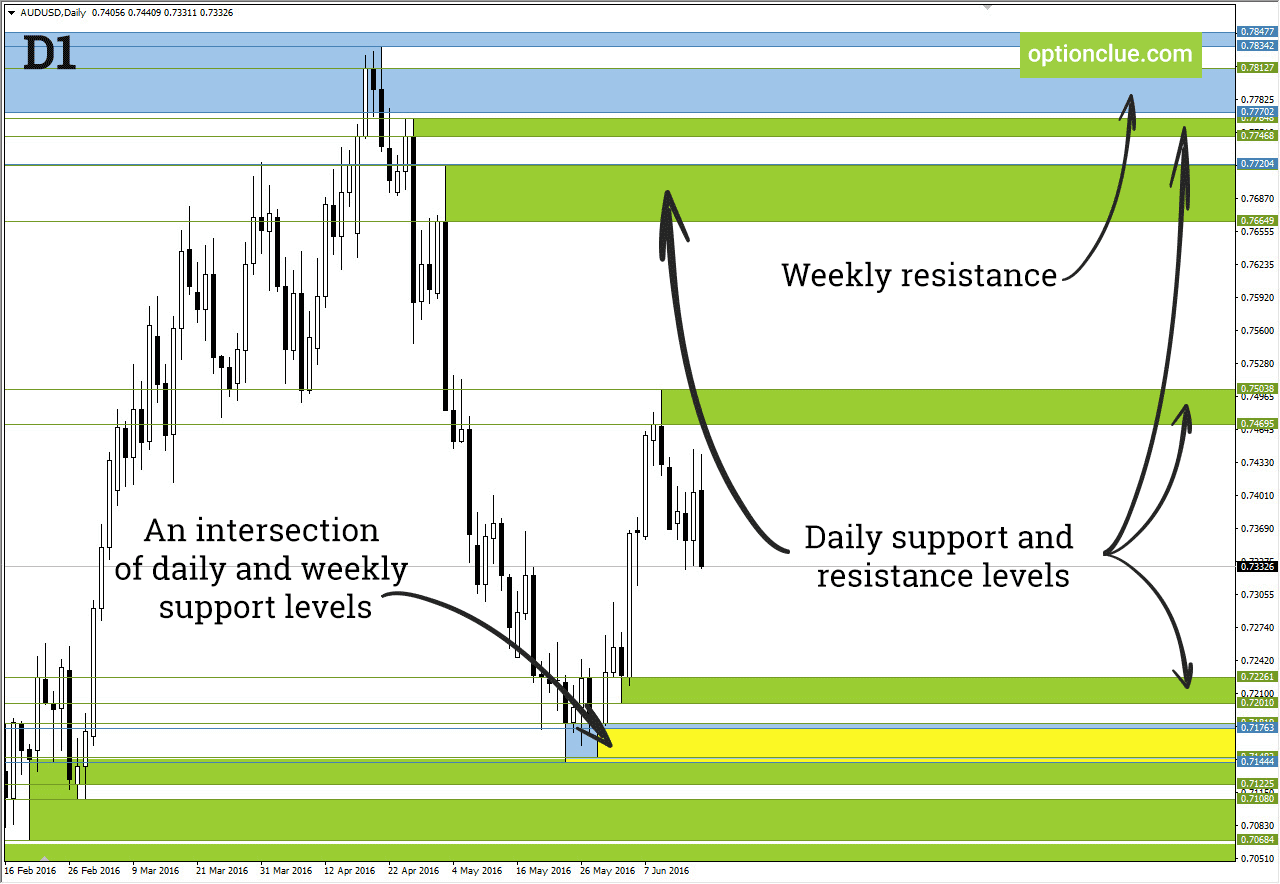
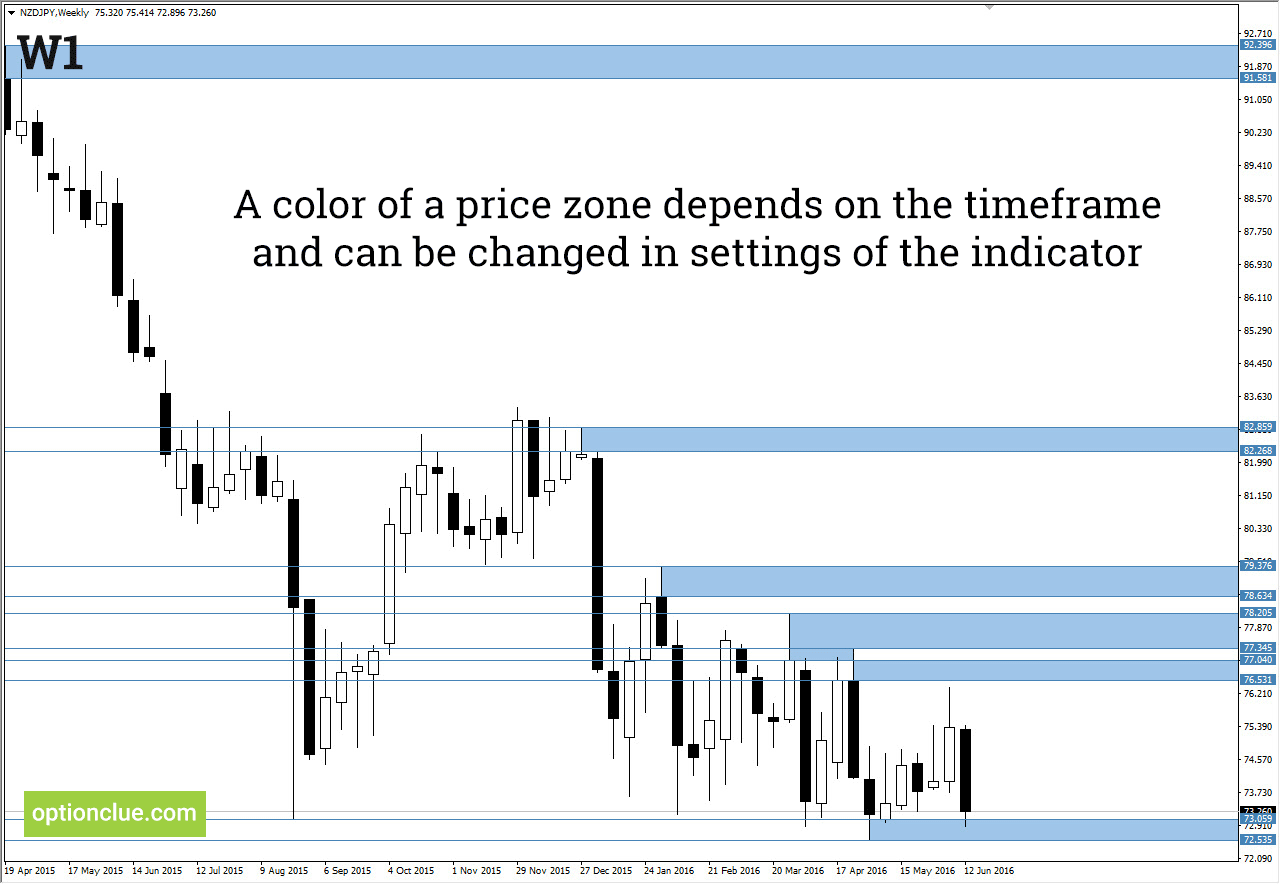
Los colores de la zona de precios y de las líneas horizontales dependen del marco temporal y pueden modificarse en los ajustes del indicador. El indicador traza niveles de soporte y resistencia en los marcos temporales seleccionados e inferiores. Mantiene los gráficos lo más claros posible y permite ver los niveles de precios más importantes sin necesidad de cambiar entre marcos temporales.
Ventajas del indicador
- Versatilidad - los niveles horizontales de soporte y resistencia son universales y pueden utilizarse sin ajustarse a los datos históricos.
- Simplicidad - la mayoría de los ajustes del indicador están relacionados con el color
- Absolutidad - a diferencia de muchos indicadores técnicos (Media Móvil, RSI, Estocástico y otros) Niveles se basa en la pura acción del precio, y no en sus derivados.
- Los operadores se ven obligados a replantear los niveles de soporte y resistencia todo el tiempo. Y cuanto más bajo sea el marco temporal, más a menudo deberá actualizar los niveles de precios más cercanos. Esta tarea se simplifica enormemente con la ayuda del indicador.
Cómo se crean los niveles de soporte y resistencia
Los niveles horizontales de soporte y resistencia se han utilizado en el trading desde principios del siglo XX. Funcionan porque los operadores creen que deben hacerlo. El indicador Levels traza niveles de soporte y resistencia basándose en patrones de precios que se producen en puntos locales de inversión de precios en el gráfico. Son universales y pueden utilizarse sin ajustarse a datos históricos.
Visualización en el gráfico
Los colores de la zona de precios y de las líneas horizontales dependen del marco temporal y pueden modificarse en los ajustes del indicador. El indicador traza los niveles de soporte y resistencia en el marco temporal seleccionado y en los inferiores. Mantiene los gráficos lo más claros posible y permite ver los niveles de precios más importantes sin necesidad de cambiar de un marco temporal a otro. Una intercepción de niveles en diferentes marcos temporales suele ser una zona de precios importante y se muestra en el gráfico como una combinación de colores.
Los parámetros más adecuados para cada marco temporal pueden seleccionarse en los ajustes del indicador
- Trazar niveles en este marco temporal ( sí = verdadero, no = falso). El indicador traza niveles horizontales en diferentes marcos temporales, Diario por defecto. Para ver, por ejemplo, los niveles horarios (H1), ajuste el parámetro "Trazar niveles en el marco temporal H1" de falso a verdadero.
- Un número de pares de niveles ( 1 par de niveles significa soporte y resistencia). Por defecto, este parámetro es igual a 1, por lo que sólo hay un soporte y una resistencia en cada marco de tiempo seleccionado. En la mayoría de los casos, este número de niveles es suficiente para determinar los principales objetivos de precio.
- El color de la zona de soporte o resistencia
- El color del nivel de precio de soporte o resistencia
La parte inferior de la ventana contiene los ajustes generales, que se aplican a cada marco temporal:
- Laprofundidad de trazado es igual a 200 barras por defecto. Esto significa que los niveles de soporte y resistencia se construyen utilizando las últimas 200 barras. Cuanto mayor sea la profundidad de trazado, más distantes serán los niveles trazados y mayor será la carga del sistema. Si usted está interesado en 1-2 niveles más cercanos, puede considerar disminuir este parámetro a 30-40.
- Trazar zonas de precios superpuestas ( sí = verdadero, no = falso). Este parámetro permite elegir si las zonas de precios superpuestas de un marco temporal similar se trazan o no. Esto hace que el gráfico de precios sea más claro y vívido. Este parámetro está desactivado por defecto, pero si desea ver todos los niveles posibles y sus solapamientos, puede considerar activarlo.