Levels for MT4 by OptionClue
- 지표
- 버전: 2.3
- 활성화: 5

The Levels indicator has been created to simplify the process of plotting support and resistance levels and zones on selected timeframes. The indicator plots the nearest levels of the selected timeframes, which are highlighted in different colors. It significantly reduces the time needed to plot them on the chart and simplifies the market analysis process.
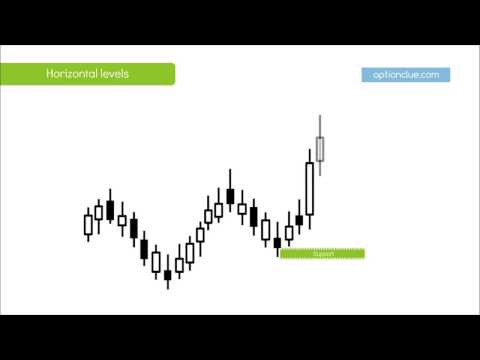
Horizontal support and resistance levels are used to identify price zones where the market movement can slow down or a price reversal is likely to occur. The Levels indicator helps identify the optimal entry and exit signals that appear during a deep market correction, or calculate stop loss and take profit.
The Levels indicator plots support and resistance levels based on price patterns which occur in local price reversal points on the chart. They are universal and can be used without fitting to historical data. Currently, the Levels indicator includes 28 price patterns that complement each other.
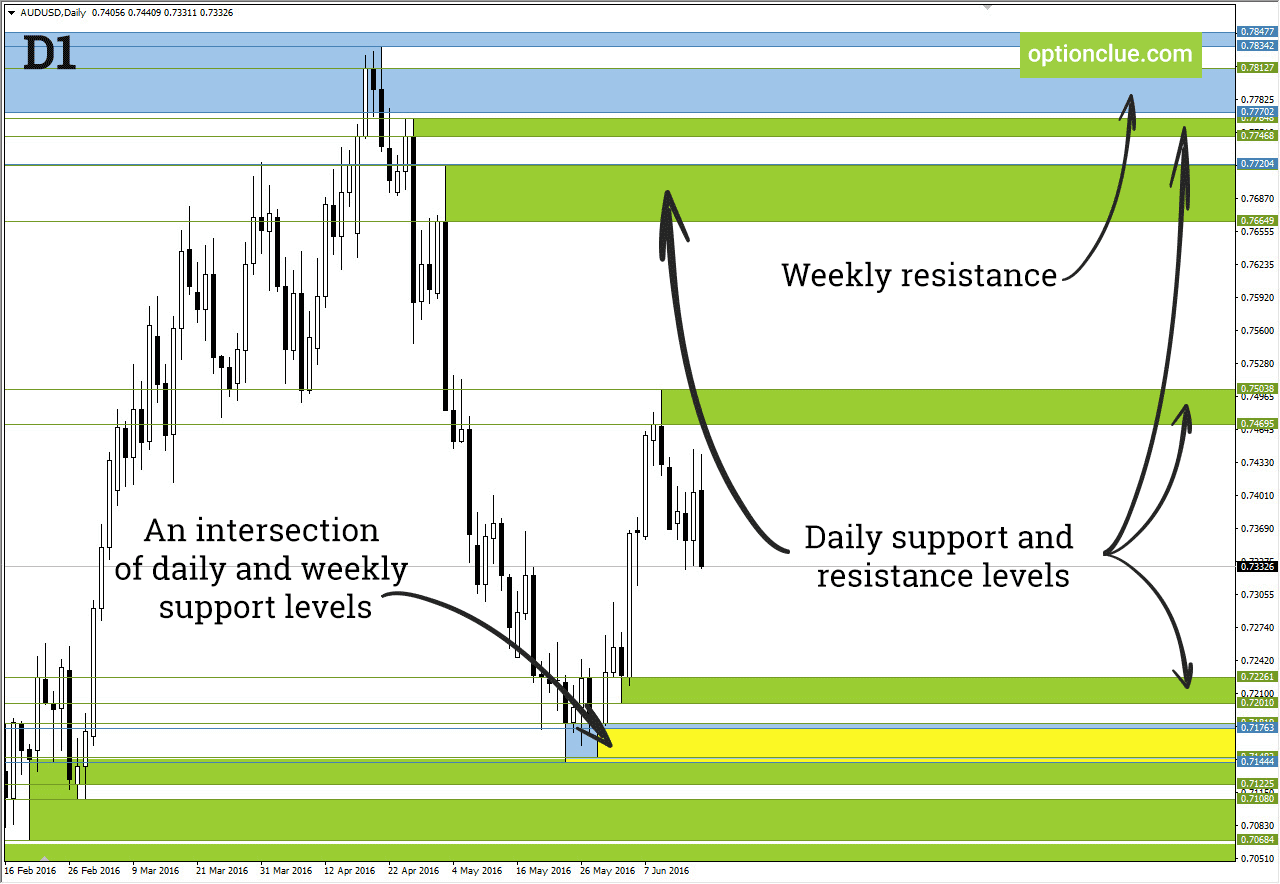
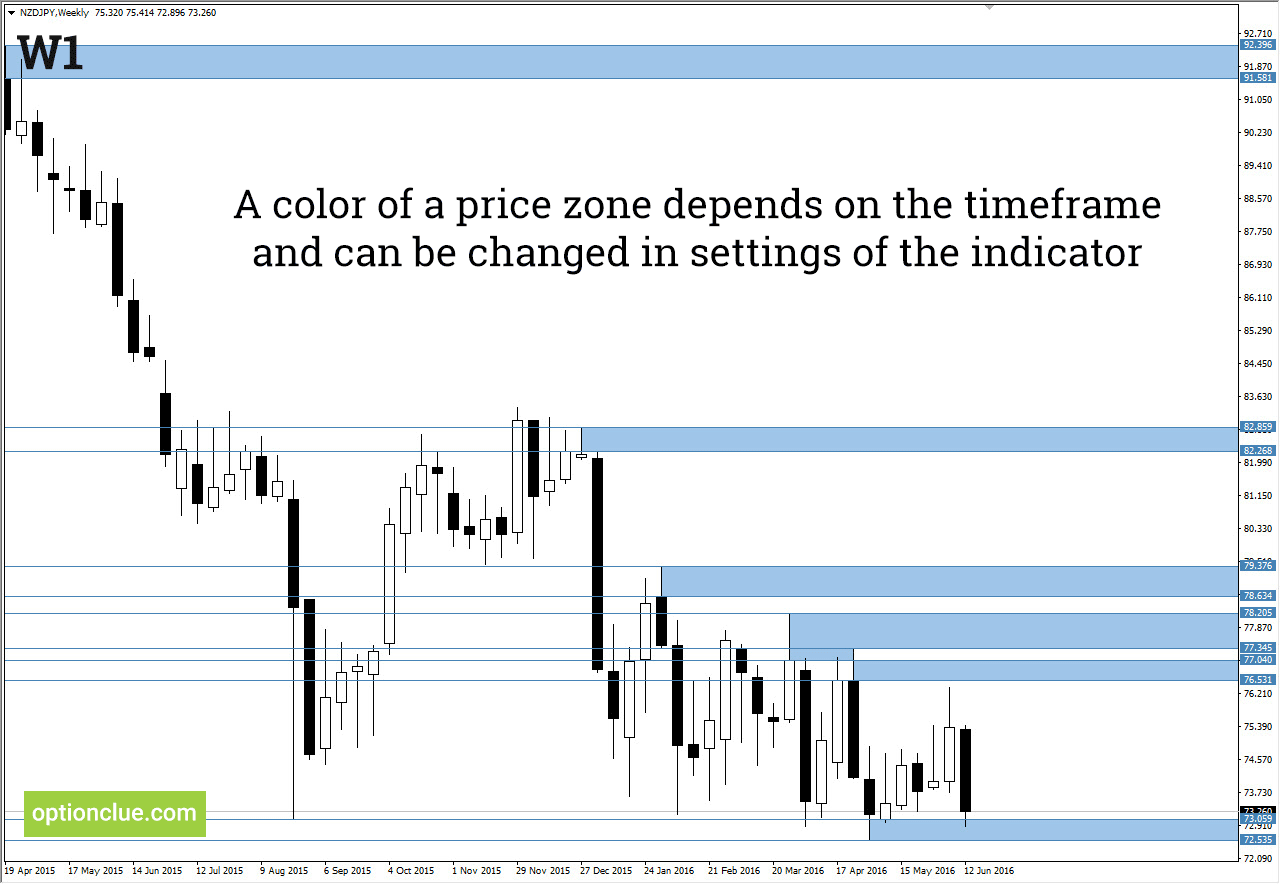
The colors of the price zone and horizontal lines depends on the timeframe and can be changed in settings of the indicator. The indicator plots support and resistance levels on the selected and lower timeframes. It keeps charts as clear as possible and lets one see the most important price levels without switching between timeframes.
Advantages of the indicator
- Versatility — horizontal support and resistance levels are universal and can be used without fitting to historical data
- Simplicity — most of the indicator settings are related to color
- Absoluteness — unlike many technical indicators (Moving Average, RSI, Stochastic and others) Levels is based on the pure price action, and not on its derivatives.
- Traders are forced to replot support and resistance levels all the time. And the lower the timeframe the more often you should actualize the nearest price levels. This task is greatly simplified with the help of the indicator.
How support and resistance levels are created
Horizontal support and resistance levels have been used in trading since the beginning of the 20th century. They work because traders think that they have to. The Levels indicator plots support and resistance levels based on price patterns which occur in local price reversal points on the chart. They are universal and can be used without fitting to historical data.
Display on the chart
The colors of the price zone and horizontal lines depends on the timeframe and can be changed in settings of the indicator. The indicator plots support and resistance levels on the selected and lower timeframes. It keeps charts as clear as possible and lets one see the most important price levels without switching between timeframes. An interception of levels on different timeframes is often an important price zone and it is displayed on the chart as a combination of colors.
The most suitable parameters for each timeframe can be selected in the indicator settings
- Plot levels on this timeframe (yes = true, no = false). The indicator plots horizontal levels on different timeframes, Daily by default. In order to see, for example, hourly (H1) levels, set the "Plot levels on H1 timeframe" parameter from false to true.
- A number of levels pairs (1 levels pair means support and resistance). By default, this parameter equals 1, so there is only one support and one resistance on every selected timeframe. In most cases, such number of levels is sufficient to determine the major price targets.
- The color of support or resistance zone
- The color of support or resistance price level
The lower part of the window contains general settings, that are applied to every timeframe:
- Plotting depth is equal to 200 bars by default. It means that support and resistance levels are built using the last 200 bars. The higher the plotting depth the more distant levels are plotted and the higher the system load. If you are interested in 1-2 nearest levels, you might consider decreasing this parameter to 30-40.
- Plot overlapping price zones (yes = true, no = false). This parameter lets one choose whether overlapping price zones of a similar timeframe are plotted or not. It makes the price chart clearer and more vivid. This parameter is disabled by default, but if one wants to see all possible levels and their overlaps, one might consider turning it on.