Polynom Moving and Channel
- Indicadores
- Versión: 1.6
- Actualizado: 29 marzo 2023
- Activaciones: 5

El uso de una expansión polinómica de los datos abre nuevas posibilidades de análisis y toma de decisiones. Pero el problema de todos los algoritmos existentes es un cálculo muy lento.
La principal característica de este indicador es su rápido algoritmo. La velocidad de cálculo del algoritmo polinómico y de sus valores de desviación típica es varios miles de veces superior a la de los algoritmos convencionales. Por lo tanto, se trata de un algoritmo cómodo de utilizar sin necesidad de recurrir a superordenadores.
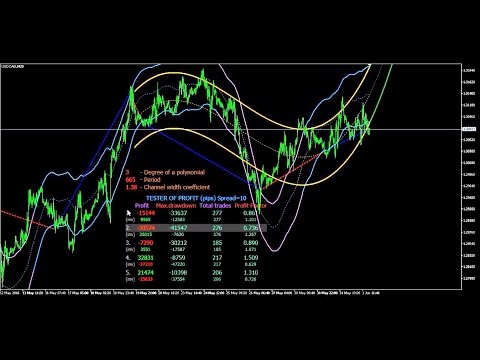
Además, a partir de la versión 1.4, el indicador ofrece un probador de estrategias integrado con visualización de operaciones y cálculo simultáneo del beneficio (en pips), de la reducción máxima (en pips), del número total de operaciones y del factor de beneficio (beneficio total/pérdida total), así como la visualización de estos datos en forma de tabla. Dispone de 10 ejemplos de estrategias: 5 de canal y 5 de no canal, así como sus estrategias inversas (Venta y Compra se invierten). Las funciones del Probador pueden ampliarse aún más aplicando el indicador a otro indicador, por ejemplo RSI. Para acceder al comprobador, pulse "T" (Tester). Para seleccionar una estrategia, sitúe el puntero del ratón sobre la línea de información de la estrategia. En el menú emergente aparece una breve descripción de la estrategia. Puede cambiar entre estrategias de canal y sin canal pulsando "C" (Canal). Además, tenemos previsto añadir un sencillo constructor visual de estrategias, que permitirá crear estrategias personalizadas directamente desde la ventana del indicador.
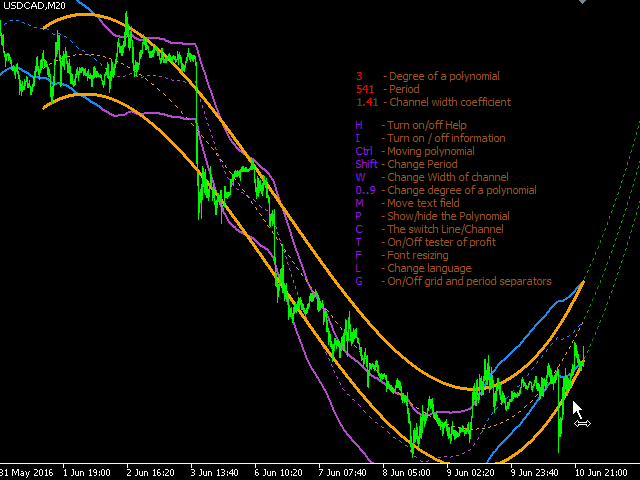
Otra característica destacable es la posibilidad de configurar los parámetros desde la ventana del indicador utilizando la tecla y el ratón. Este método es más intuitivo, rápido y sencillo. Pulse "H" (Ayuda) para obtener consejos sobre las teclas de acceso rápido, así como para ver el vídeo adjunto.
Se ha añadido soporte de idiomas (8 idiomas), que se mejorará y ampliará aún más. Puede seleccionar un idioma desde la ventana de propiedades o pulsando "L" (Idioma).
Líneas indicadoras
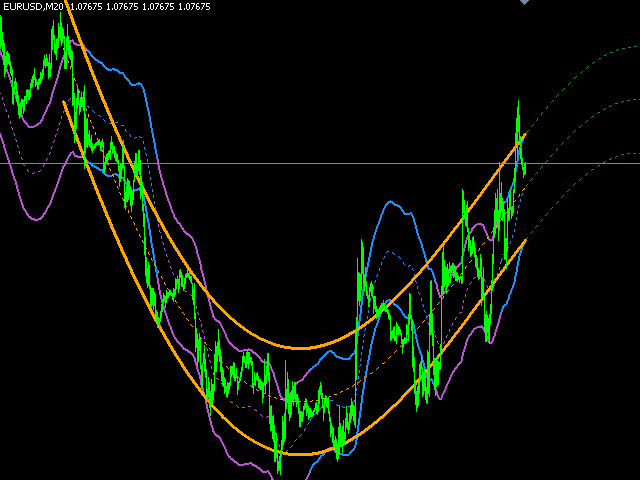
- Líneas amarillas - se redibujan con cada tick del canal polinómico. Líneas verdes discontinuas - extrapolación del polinomio hacia el futuro.
- Líneas bicolores - canal no redibujado, trazos de un polinomio amarillo. La línea es azul cuando los trazos del polinomio se dirigen hacia arriba, púrpura - cuando se dirigen hacia abajo.
- Línea roja - Venta, línea azul - Compra. Se muestra cuando el Probador está encendido.
Parámetros del indicador
- Seleccionar idioma - selección del idioma
- Grado del polinomio - 0 a 20.
- 0 - simple МА (canal de las Bandas de Bollinger)
- 1 - regresión lineal
- 2 - regresión no lineal sin puntos de inflexión (arco)
- 3 - regresión no lineal con un punto de inflexión (onda)
- etc.
- Número de barras para el cálculo (periodo) .
- Anchura del canal, 0-no dibujar canal, 1-anchura=desviación estándar:
- 0 - no dibujar un canal
- 1 - la anchura del canal es igual a la desviación típica del polinomio
- Barras para extrapolar en el futuro
- ¿Mostrar Polinomio? - mostrar/ocultar polinomio.
- Dispersión para Probador. - elija el valor de dispersión para probar.
El grado de un polinomio está limitado a 20. ya que el aumento de su número provoca el problema de menor precisión y desbordamiento del valor máximo de tipo double, ya que su valor máximo es 1.7976931348623158e+308, y la precisión es de 15 dígitos significativos después del punto decimal. Cuanto mayor sea el Grado del polinomio y su Periodo, mayor será la probabilidad de desbordamiento y el indicador no podrá realizar los cálculos o sus datos serán incorrectos. Este problema puede resolverse fácilmente mediante el uso de bibliotecas especiales de alta precisión con dll. Pero eso es otra historia, y no estoy seguro de si usted necesita esto. En mi opinión será suficiente para utilizar el indicador con el grado polinómico por debajo de 10. Recomiendo no superar este valor, ya que puede reducir significativamente la velocidad de rendimiento del indicador.
PS: Este indicador fue desarrollado inicialmente para MQL5, y su copia exacta para MetaTrader 5 está disponible en el Mercado. El video adjunto se ha realizado sobre la base de la plataforma MetaTrader 5. Funciona de la misma manera en MetaTrader 4. Las únicas diferencias son que, por desgracia, el MetaTrader 4 no permite trazar el indicador sobre la base de otros indicadores como se muestra en el vídeo en el ejemplo de RSI. Además, el MetaTrader 5 implementa el ahorro de los parámetros modificados en la ventana al cambiar los plazos. Además, el mismo código se ejecuta significativamente más rápido en MetaTrader 5. Pero no he retomado el video para MetaTrader 4, ya que supongo que será útil para conocer las características de MetaTrader 5. Así que recomiendo a todos a empezar a trabajar en MetaTrader 5.


I really like this! It's very useful. I will eventually get the Fast Polynomial because the update looks like it allows the settings to be kept when you change time frames. It's a pain changing them every time. I still love it. I have a version made by someone else on my phone and computer but it's not as good as this one even though it has buy and sell signals. It's exactly what I was looking for. Thanks!