Смотри обучающее видео по маркету на YouTube
Как купить торгового робота или индикатор
Запусти робота на
виртуальном хостинге
виртуальном хостинге
Протестируй индикатор/робота перед покупкой
Хочешь зарабатывать в Маркете?
Как подать продукт, чтобы его покупали
Технические индикаторы для MetaTrader 4 - 41

Данный индикатор помогает определять развитие цены в зависимости от способа отображения этих летающих объектов на графике. Когда планер значительно раскрывает свои крылья, он предупреждает о возможной смене тренда. Напротив, когда кажется, что она ускоряется (выглядит тонкой, потому что линии крыльев сгруппированы), она показывает безопасность и продолжение тренда. Каждое крыло планера является направляющей между ценой закрытия и ценами максимума/минимума предыдущих баров. Цвет (зеленый/красный)
FREE

The Red Dragons Support and Resistance Levels indicator automatically determines support and resistance levels using the proprietary algorithm based on historical and current data, so the levels are dynamic, which allows you to adjust trading targets based on the current price movement. For this reason, we use this indicator in our advisors, for example, Red Dragons, which you can purchase here:
https://www.mql5.com/en/market/product/128713?source=Site +Market+MT4+New+Rating006
The panel also
FREE

Fast T3 MA Trend indicator derived from T3 moving averages. This indicator is part of the T3 Cloud MA indicator and is posted here on its own. Buying/Selling opportunities above/below line. The MA line can also be used as dynamic support/resistance for more aggressive entries. Use default values for best settings. The number of look back bars is user defined. This indicator can be used in combination with other strategies such as price action. Suitable for all time frames.
FREE

Todays High and Low
This indicator draws lines at the highest price of the day and at the lowest price of the day. Both lines are ended with labels with the maximum and minimum prices written. Lines and labels are moved according to the chart progress in real time. The indicator works on all chart time intervals. You can change and set colors and shift the chart. The indicator allows you to observe the price movement on the chart and not lose sight of the price maxima and minima achieved.
FREE
"Visual Range - Spread Indicator". This Indicator is an Essential Tool for Manual trading. it helps to avoid "off price" and "bad" entries caused by abnormally High spreads. ...................................................................................................................... At the Market Opening and News Reports - the Size of the Spread can go temporarily widely High. The Indicator shows the current Size of the Spread visually on the chart and its distance from the current pr
FREE
Questo indicatore per MT4 traccia automaticamente i punti di pivot giornalieri sul grafico, fornendo livelli chiave di supporto e resistenza basati sui prezzi di apertura, chiusura, massimo e minimo del giorno precedente. I punti pivot aiutano i trader a identificare potenziali aree di inversione e zone di prezzo critiche, migliorando la precisione nelle decisioni operative quotidiane."
FREE
The MA in Color_PRT Indicator offers valuable insights into market trends by displaying moving averages in different colors based on their direction. Green indicates an uptrend, red for a downtrend, and yellow for a consolidation phase. Traders can use this indicator to easily identify potential entry and exit points in their forex trades. When the lines change color, it can signal a change in market direction, giving traders an opportunity to adjust their strategy accordingly. Additionally, th
FREE
Индикатор Trender определяет смену тренда. Для того чтобы её не пропустить, настройте его на отправку уведомлений в ваш мобильный терминал (Push), или в виде алерта ( Alert ), или по Email. Также индикатор предоставляет потенциальные точки входа и расчитывает и отображает уровни стоплосс и тейкпрофит.
Преимущества: - Не перерисовывается - Может помочь в фильтрации сигналов в вашей стратегии - Работает на всех парах и таймфреймах - Прост в настройке - Даёт уже готовые сигналы для открытия пози
FREE
WONNFX iSTATS - information indicator showing profit/loss on your MT4 account (pips, lots, currency, percentage) current profit profit for today profits for the current week profits for the current month profit for the current quarter profit for the current year
A convenient format for displaying statistics of your trading account in real time. (the indicator can be installed on any MT4 terminal chart)
FREE

Канал фрактальной дивергенции базируется на паттернах фрактальной дивергенции , представляя их в виде канала, границы которого изменяются в момент появления очередного паттерна. Верхняя граница канала соответствует верхней части последнего найденного медвежьего паттерна фрактальной дивергенции. Нижняя граница канала - это нижняя часть последнего найденного бычьего паттерна (см. скриншот 1). По отношению к индикатору FractalDivergence_Patterns , канальная версия обладает теми же параметрами, к ко
FREE
Rectangle Control простой индикатор который отображает на графике панель для рисования прямоугольников с различными настройками, будет удобен тем кто рисует на графике зоны поддержки, сопротивления. Прямоугольник можно нарисовать с заливкой или без, различной толщины и цвета. А также выбрать таймфрейм на котором нарисованный прямоугольник будет отображаться. При нажатой кнопке алерт будет срабатывать оповещение (если прямоугольник находиться ниже цены на верхнем его краю, если прямоугольник нах
FREE

Maltese cross GBP Универсальный инструмент для определения трендов, флетов и торговли по графическим паттернам. Объединяет техники Гана, Эллиота, Мюррея.
Просто разместите его на графике и он покажет направление и скорость движения цены, выделит разворотные моменты. Maltese cross поможет точно определять узловые моменты в истории, планировать торговые действия и сопровождать открытые сделки. Эта бесплатная демонстрационная версия MalteseCross ограничена GBPUSD и кроссами GBP. Никаких прочих о
FREE
Осциллятор направленности тренда с дополнительной фильтрацией флета Помогает быстро сориентироваться при изменении направления движения цены и раскрашивается в соответствующий цвет Работает на всех таймфреймах, на любых валютных парах, металлах и криптовалюте Можно использовать при работе с бинарными опционами Отличительные особенности Не перерисовывается; Фильтрация флета - когда гистограмма находится в желтой зоне; Простые и понятные настройки; Работает на всех таймфреймах и на всех символах;
FREE

MA Reminder Overview MA Reminder is a versatile moving average indicator that provides visual cues and background coloring to help traders identify trend direction and potential trading opportunities based on MA crossovers. Key Features Multiple Moving Averages : Displays up to 4 configurable moving averages on the chart Background Coloring : Highlights chart background based on MA1 and MA2 crossovers Timeframe Flexibility : Choose between dynamic (follows chart timeframe) or fixed timeframe mod
FREE

Индикатор MQLTA Support Resistance Lines вычисляет исторические уровни поддержки и сопротивления и отображает их на графике в виде линий. Он также отправит оповещение, если цена находится в опасной/безопасной зоне для торговли, и покажет расстояние до следующего уровня. Индикатор идеально подходит для использования в советниках через функцию iCustom. Данная демо-версия работает только на паре AUDNZD. Полная версия доступна по ссылке: https://www.mql5.com/ru/market/product/26328
Как он работает?
FREE
Данный индикатор позволяет сканировать символы в окне "Обзор рынка" (не более 15 в демо-версии), отфильтровывать тренды и отправлять оповещения. Он работает на основе популярного индикатора "Bollinger Bands" , который используется многими трейдерами для торговли: Когда цвет ячейки меняется на " зеленый " или " красный ", это указывает на изменение тренда для открытия длинной или короткой позиции. Также появится экранное уведомление. Когда цвет меняется на зеленый , это указывает на восходящий тр
FREE
Become a constantly profitable 5-star forex trader!
We offer a few indicators to support you understand and analyse the market! With our strategies you will improve your trading system and bacome an expert...
We have indicators for trend direction, market direction and others.. for multi-time frames and that covers all majors or your favorite trading symbols! Some of them offer a customizable calculation parameters... or Graph features!
See how powerful they are! The are also easy-to-use tr
FREE

Индикатор работает как расширение, перекрашивает свечи и фон в терминале по одному нажатию кнопки (Ночная тема /дневная тема). Пользователь может также задать отображение водяного знака символа, и указать его размер. Интерактивное меню позволяет переключать отображение значение Ask. И переключать масштабирование графика с адаптивного на фиксированный одним нажатием. Можно добавить в настройки вашу любимую цветовую схему для переключения.
FREE
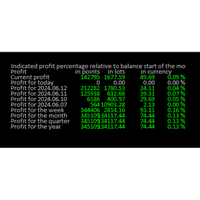
Онлайн-дневник: Этот индикатор разработан, чтобы помочь трейдерам отслеживать прибыль и убытки за различные временные периоды, такие как текущая прибыль, прибыль за сегодня, прибыль за вчера и так далее, до прибыли за текущий год. Индикатор предлагает несколько вариантов настройки, таких как расчет процентной прибыли относительно баланса на начало дня, недели, месяца, квартала или года. Он также позволяет настраивать размещение текста и цвета в соответствии с потребностями пользователя.
FREE
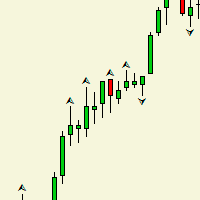
Индикатор рисует на графике фрактал, и в чем отличие между обычным фракталом? спросите вы. Ответ таково,_ после формирования второго бара фрактал рисуется и не удаляется в отличие от обычного. Данный индикатор создан в целях расширения Торгового робота. Она составляет одним из важнейших частью робота. Таким как выход из торгов. У индикатора нет входных параметров.
FREE

This indicator is a histogram showing the trend based on 3 different moving averages. When all averages are set in ascending order, the indicator is green, and when in descending order, it is red. If the averages do not show a trend, the color is yellow. Additionally, each average can have different settings, such as Mode MA and Price MA. You can also set an alert and receive notifications on your phone.
To enable the alert and push notification, you need to activate them first in the MT4 settin
FREE

Useful indicator that incorporates three moving averages, for your favorite trading strategy. Moving averages are fully configurable, Period, Method, Color, Etc Just place it on your favorite timeframe.
The benefits you get : Never redesigns, does not retreat, never recalculates. Works on forex and CFD, timeframe from M1 to Monthly. Easy to use. Convenience for your trading.
FREE

Supporting file (2 of 2) for T3 Cloud MA
Trend indicator derived from T3 moving averages. The cloud is bounded by a fast T3 and slow T3 lines. Buying/Selling opportunities above/below cloud. The fast and slow T3 MA lines can also be used as dynamic support/resistance for more aggressive entries. Use default values for best settings. The number of look back bars is user defined. This indicator can be used in combination with other strategies such as price action. Suitable for all time frames. Pr
FREE
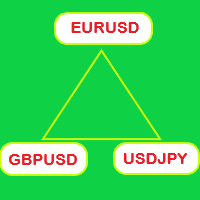
Switch symbols and timeframe by arrow buttons 1. You can switch multiple symbols of one or all charts. 2. You can set list of symbols to switch between them or get them from Market Watch. 3. You can change timeframe of one or all charts. List of timeframes here [M1, M5, M15, M30, H1, H4, D1, W1, MN1]. Switch symbol of all charts: indicator check current symbol of the chart to get index of it in list and change for next or previous. Key functions: - Right arrow key: switch to next symbol. - Left
FREE

This indicator draws on the chart high and low prices of different periods . And If you want, Indicator can alert you when the current price arrive these levels. Alert Options: Send Mobil Message, Send E-mail, Show Message, Sound Alert Time Periods: M1, M5, M15, M30, H1, H4, D1, W1, MN Inputs: TimeShift: You can set start hour for calculating. And that way you can see levels independently from broker server's time-zone. PipDeviation: You can set price sensibility for alert (Default: 3) Lines
FREE

Candle Time At Price — Precision Countdown Directly Beside the Candle Candle Time At Price is a lightweight, smart, and visually elegant indicator that displays the remaining time of the current candle right next to price — exactly where your eyes are focused. It’s designed for traders who value clean charting, precision, and zero distractions. Key Features: Real-Time Countdown — Displays the exact time left before the current candle closes. Price-Anchored Display — The timer moves wi
FREE
This indicator allows to hide Stochastic oscillator (on all MT4 timeframes) from a date define by the user, with a vertical line (Alone) or a panel (with "Hidden Candles"). Indicator Inputs: % K Period % D Period Slowing Apply To Method Information on "Stochastic Oscillator" indicator is available here: https://www.metatrader4.com/en/trading-platform/help/analytics/tech_indicators/stochastic_oscillator ************************************************************* Hey traders!! Give me your
FREE

TPP : Turning Point Pattern The indicator shows the market Turning Point Pattern as arrows. The reversal signals are based on observation of price action and market behavior. It is based on the principles of searching for extremums, volatility, and candlestick pattern. The indicator provides signals on the following principles: Search for the end of the ascending/descending trend Search for the reversal pattern based on candlestick pattern Confirmation of the reversal by the volatility. The in
FREE

RaysFX StochRSI Presentiamo un indicatore MQL4 sviluppato da RaysFX, un rinomato sviluppatore nel campo del trading algoritmico. Questo indicatore è una combinazione semplice ma potente di due indicatori popolari: RSI e Stocastico. Caratteristiche principali: RSI : Un indicatore di momentum che misura la velocità e il cambiamento dei movimenti dei prezzi. Stocastico : Un indicatore di momentum che confronta il prezzo di chiusura di un titolo con la gamma dei suoi prezzi durante un certo periodo
FREE

CUSTOM Currency strength indicator
-CHOOSE ANY CURENCIES that you want to calculate strength for, indicator will automatically compare all symbols /pairs from 8 selected currencies based on KU-chart calculations.
-8 major currencies are used by default
-add indicator to any chart
-made for 15min timeframe= last 1 day change calculated, 30min = last 2 days and so on
-clear currency distinguish by color and name on chart
-if you chose non-standard currency, make sure all of inputted values hav
FREE

Индикатор предназначен для внутридневной торговли. Оснащен всеми функциями оповещения для удобства в ручной торговле. Рекомендуется использовать таймфреймы м5, м15, м30. Также вы можете посмотреть и подобрать настройки для любого финансового инструмента. Подпишись на мой telegram канал, ссылка в контактах моего профиля . Настройки: Indicator period - Период индикатора Alerts - Функция включения алертов. Push notifications - Включение Push-уведомлений на мобильный терминал e-mail - Отправка с
FREE

(Google Переводчик) Этот индикатор был вдохновлен средним истинным диапазоном (ATR) Джона Уэллса Уайлдера , но с некоторой дополнительной информацией. Точно так же он вычисляет экспоненциальное скользящее среднее истинного диапазона, но использует стандартный альфа-вес вместо Уайлдера . Он также вычисляет среднее отклонение от среднего диапазона и отображает его как смещение. Это помогает не только быстрее определить изменение, но и его влияние. (Original text) This indicator was inspired by Joh
FREE
Этот индикатор упрощает процесс создания шаблонов графиков, позволяя сохранить текущие настройки графика в шаблон всего одним нажатием кнопки. Индикатор добавляет кнопку прямо на график, которая автоматически сохраняет шаблон с заданным именем и префиксом, что упрощает организацию и использование шаблонов. Основные функции индикатора: Создание шаблона текущего графика одним нажатием на кнопку. Возможность задания префикса для имени шаблона, что позволяет легко различать их. Поддержка нескольких
FREE

Индикатор показывает разность цен открытия и закрытия. Индикатор в отдельном окне - это разность цен открытия текущего бара с ценой закрытия предыдущего бара. Табло в верхнем левом углу - это разность цен открытия и закрытия текущего бара.
Настройки Count_Bars - количество баров для отображения данных индикатора, при 0 отображается на всех доступных барах; display - включить отображение цифровых значений; _fontsize - размер шрифта для индикатора в отдельном окне; color_up - цвет положительных з
FREE

'Circle Rising Point' is an indicator based on the cycle theory. No matter whether your trading cycle is short or long, you can use this indicator to find the rise and fall points of different cycles and different bands. Therefore, the signals displayed to you on charts of different cycles are different, and applicable to left side transactions. This indicator is recommended to be used together with the multi cycle window for analysis. Indicator introduction Applicable products This indicato
FREE

The indicator marks bars with a simple trend definition“ each subsequent high above/below the previous one and each subsequent low above/below the previous one ”. Charles Dow
Formula:
Max – The current maximum Min – The current minimum MaxK – Maximum per period MinK – Minimum per period Min>MinK & Max>=MaxK – Symbol on top Max<MaxK & Min<=MinK – The symbol on the bottom
Input parameter:
Number of bars in the calculated history Period for current timeframe The distance to the symbol Se
FREE
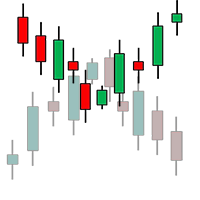
Th3Eng Chart shadow indicator is a tool helps you to display another symbol on the current symbol in candles style or line. You can type the second symbol name in the setting and select the drawing mode { candles or line }. Also, the indicator displays the spread and current price of both pairs on the left top side corner of the chart.
setting: 1- Symbol: Insert The second symbol name. 2- Drawing mode: Choose the draw mode from (Candles or line). 3- Show spreads: true\false to display the pric
FREE

Velvet RSI is intended for use with the Velvet advanced ordering layer. It is a modified version of the RSI indicator provided by Metaquotes and all of the data it displays is accurate and verified, when it is detected by the ordering layer. In order to place orders with the Velvet RSI indicator, the ordering layer must be installed and running. Ordering from the Velvet RSI indicator requires that "Velvet Ordering Layer" ( found here ), version 1.0 or higher, be installed and running. When de
FREE
Velvet MACD is intended for use with the Velvet advanced ordering layer. It is a modified version of the MACD indicator provided by Metaquotes and all of the data it displays is accurate and verified, when it is detected by the ordering layer. In order to place orders with the Velvet MACD indicator, the ordering layer must be installed and running. Ordering from the Velvet MACD indicator requires that "Velvet Ordering Layer" ( found here ), version 2.0 or higher, be installed and running. Whe
FREE

Всем привет, мои друзья, сябрыыы. Я трейдер, 20 лет опыта. Хочу продемонстрировать свой индикатор. Индикатор создан на базе в тесной кооперации с индикатором arrows_template. Данный индикатор рисует на графике инструмента (любого) индикатор AO(Awesom) поверх. Видите сам AO на графике. Видите пересечение зоны нуля, Блюдце и т.д.. Если будут подсказки, корректировки. Пишите смело, всех пошлю.......Шутка До свидания.
FREE
Целью этой новой версии стандартного MT4 индикатора, входящего в поставку платформы, является отображение в подокне нескольких таймфреймах одного и того же индикатора. См. пример, приведенный на рисунке ниже. Однако индикатор отражается не как простой индикатор MTF. Это реальное отображение индикатора на его таймфрейме. Доступные настройки в индикаторе FFx: Выбор таймфрейма для отображения (от M1 до MN) Установка ширины (количество баров) для каждого окна таймфрейма Всплывающее оповещение/звуков
FREE

Целью этой новой версии стандартного MT4 индикатора, входящего в поставку платформы, является отображение в подокне нескольких таймфреймах одного и того же индикатора. См. пример, приведенный на рисунке ниже. Однако индикатор отражается не как простой индикатор MTF. Это реальное отображение индикатора на его таймфрейме. Доступные настройки в индикаторе FFx: Выбор таймфрейма для отображения (от M1 до MN) Установка ширины (количество баров) для каждого окна таймфрейма Всплывающее оповещение/звуков
FREE

Индикатор LevelsPivotMT4 строит опорные точки и формирует уровни поддержки и сопротивления. Не перерисовывается.
Цвета по умолчанию Желтый - опорная точка; Зеленый - уровни сопротивления R1, R2, R3; Красный - уровни поддержки S1, S2, S3. Устанавливается как любой стандартный индикатор.
Правила анализа Торговать на отскок от линий поддержки или сопротивлений. Цель, соответственно, будет центральная линия (опорная точка, по умолчанию - желтого цвета).
FREE

RaysFX Market Trend Histogram Il RaysFX Market Trend Histogram è un indicatore personalizzato per la piattaforma di trading MetaTrader 4. Utilizza il Commodity Channel Index (CCI) per identificare le tendenze del mercato e visualizza queste informazioni in un istogramma intuitivo. Caratteristiche principali: Identificazione delle tendenze: L’indicatore calcola il CCI per ogni periodo di tempo e lo utilizza per determinare se il mercato è in una tendenza al rialzo o al ribasso. Visualizzazione in
FREE

パラボリックのデータをもとにトレンドの方向性を1分足から月足まで表示します。 1分足から 月足 まで表示されているので今どの方向に価格が動いているのかがすぐに分かります。 更新はティク毎ではなくディフォルトでは1秒毎、もちろん変更も可能なのでチャートの表示が遅くなるようなことはありません。 機能: どの通貨でも表示可能になります。 パラボリックの数値を変更することは可能になります。 上昇時と下降時のアイコンの色を指定することが可能になります。 表示位置(Y軸)が変更可能 になります。 表示位置 (左上 、 右上 、 左下 、 右下) が 指定 が可能 になります。 フォント を指定することが可能になります。 フォントサイズ が 変更可能 になります。 アイコンのサイズ が 変更可能 になります。 週足、 月足 の非表示 が 可能 になります。
FREE

Индикатор реализован для определения классического канала движения цены, который используется на крупных биржевых площадках. Не перерисовывается Синий уровень - это уровень поддержки Красный уровень - это уровень сопротивления Белый уровень - является Pivot-уровнем Настройки Period_SEC - ввод значения периода . Примечание: Индикатор определяет уровни только на пятизначных котировках! Метод торговли: Открытие позиций осуществляется от уровней , именно на их значениях происходит отскок цены
FREE
Данный индикатор рисует линии по стандартному индикатору Fractals и при пробитии фрактала вверх или вниз выдает алерт, оповещение на электронную почту, оповещение на мобильный телефон.
Входные параметры History - Количество баров для расчета в истории. Color Up Fractal - Цвет линии верхнего фрактала. Color Down Fractal - Цвет линии нижнего фрактала. Width - Ширина линии. Alerts - Алерт. EmailAlerts - Оповещение на электронную почту. NotificationAlert - Оповещение на мобильный телефон.
FREE

Скользящая Средняя с Динамическим Периодом Усреднения (Variable Index Dynamic Average, VIDYA) - это оригинальная методика вычисления экспоненциальной скользящей средней (EMA) с динамически меняющимся периодом усреднения, разработанная Тушаром Чендом (Tushar Chande). Период VIDYA зависит от волатильности рынка, указанный осциллятором Chande Momentum Oscillator (CMO).
Сигналы индикатора VIDYA формирует сигналы на покупку и продажу, когда цена пересекает полосы вверх и вниз. Когда цена пересекает
FREE
RangePower Index is an MT4 indicator that accurately measures the strength of currencies, indices, gold and oil based on their daily range. Thanks to this, you will immediately know which assets have real momentum and which, on the contrary, are losing strength.
Daily range analysis (high–low) for currencies, indices, gold and oil Quick visualization of the strongest and weakest assets With RangePower Index you will gain a clear competitive advantage - trade only where there is real market
FREE

Precision Entry Master: Your Key to Confident Trading Tired of second-guessing your trades? The Precision Entry Master indicator is designed to help you find high-quality entry points with confidence. It combines two powerful market analyses to give you a clear signal, filtering out noise and false signals so you can focus on the best opportunities. Our unique system works by finding the perfect moment when market momentum is changing and the overall trend is in your favor. When these two condit
FREE

Please contact me at telegram https://t.me/smartforex7 After purchasing SmartForex Indicator then Use This Indicator...................... SMART EXIT PROFIT LINE Indicator is very Helpful with SmartForex Indicator ........................................ SMART EXIT PROFIT LINE Indicator Attach with SmartForex Indicator after then Red Line Show Exit buy Profit , Green Line show Exit Sell Profit................
FREE
This indicator is free and shows you the trading volume on all timeframes. You can manage your open positions by time and volume by drawing a moving average based on the desired period, as well as adding multiple levels with a better understanding of the trading volume change.
But to fully use this indicator, you can visit the Utilities section of MQL5.com and download the "Forex Time Zones " Expert Advisor.
These two tools complement each other and help you make much better time management deci
FREE
Индикатор RSI S-RoC отличается от стандартного индикатора RSI учетом скорости изменения цены при расчете своих данных. При движении цены по тренду дает хорошие сигналы для входа при касании своих уровней. Значения уровней можно задавать самостоятельно в настройках индикатора, а также при желании их можно изменять и настраивать непосредственно в окне индикатора. Кроме того имеется возможность установки на график цены сигнальных линий, при пересечении которых индикатор будет выдавать звуковое опов
FREE
Индикатор показывает текущий таймфрейм и название символа. Так же есть возможность включить показание времени до окончания текущего бара. В настройках можно указать: - расположение индикатора по отношению к окну терминала. верхний левый, верхний правый, нижний левый и нижний правый - ряд расположения отображения текста так чтобы не налазили друг на друга надписи - цвет - шрифт - размер шрифта.
FREE

This is a standard Bollinger Bands indicator. I have added a quick control panel in the bottom left corner for it. When multiple different parameters of this indicator are simultaneously enabled, the control panel can quickly switch between different parameters of the indicator, making it easier to observe multiple indicators simultaneously. For example, it is possible to quickly switch observations while combining a period of 20 and a period of 30. Parameter description: Indicator ID: The uniqu
FREE

Простой индикатор показывающий размер спреда в текущее время, максимальный за день и максимальный за все время работы индикатора.
Так же выведена ежедневная статистика максимального спреда с указанием времени, когда этот спред был зафиксирован.
Местоположение индикации полученной информации можно менять в зависимости от предпочтений и располагать в любой точке экрана. Предусмотрена возможность вывода алертов о превышении размера спреда, указанного во входных параметрах.
FREE

This classic "old school" MAGIC MACD indicator gives you the cross of the parameters you set. Standart setting is (12,26,9) . The arrows give you a possible change of trend. Be careful and do not use this indicator as a single signal source.
FREE version Please feel free to check out our other REX indicator series. We do have other free indicators.
"OLD BUT GOLD"
FREE
ARR indicator is similar to ATR but it returns percent range in relation to open price of given bar. It is mostly useful for cryptocurrency symbols where ATR ranges from years ago can't be directly compare with current values. First buffer (red dotted line) represents percent range of single bar and second buffer (white solid line) represents simple average of defined number of last bars. Only one input, PERIOD relates to number of bars used for average calculation (in default equals to 14).
FREE

O indicador é uma ferramenta desenvolvida para o MetaTrader, projetada para auxiliar na análise detalhada do comportamento do preço em relação a uma média móvel específica. Ao ser anexado ao timeframe diário, o ele realiza cálculos e monitora, em timeframes menores, quantas vezes o preço toca determinados níveis de afastamento durante o dias além de calcular a média dos toques.
MT5: https://www.mql5.com/pt/market/product/111710
FREE

O Chart Control é um indicador que permite de forma rapida e pratica alterar o timeframe e ativo do grafico, possibilitando que voce possa fazer todas as suas analises em apenas um grafico sem precisar abrir vários, além disso voce pode escolher o entre os temas claro e escuro para o qual melhor se adapta a sua preferencia.
MT5: https://www.mql5.com/pt/market/product/109444
FREE
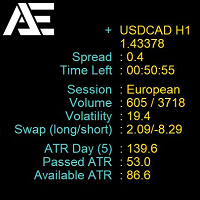
На графике EURUSD это БЕСПЛАТНО. Версия со всеми символами! Свяжитесь со мной по любым вопросам
Market Info Display — это универсальный индикатор, отображающий важную рыночную информацию, организованную в удобном интерфейсе прямо на графике. Его функции рассчитаны на эффективное отображение данных, которые помогают трейдерам принимать взвешенные решения. Он предоставляет данные о текущем спреде, времени до закрытия свечи, текущей торговой сессии, объеме, волатильности, изменении цены за де
FREE

Forex trend omega is a trend following indicator which filter market noice to make perfect entries to follow the trend or spotting trend reversals. The possibilities are endless for the use of this indicator, you can use it on any timeframe to find trends matching your trading strategy. The BEST thing about this indicator it does NOT REPAINT . This makes it a very unique indicator and is a MUST HAVE in your indicator portfolio. The indicator is really simple to use because it can be used with de
FREE

Целью этой новой версии стандартного MT4 индикатора, входящего в поставку платформы, является отображение в подокне нескольких таймфреймах одного и того же индикатора. См. пример, приведенный на рисунке ниже. Однако индикатор отражается не как простой индикатор MTF. Это реальное отображение индикатора на его таймфрейме. Доступные настройки в индикаторе FFx: Выбор таймфрейма для отображения (от M1 до MN) Установка ширины (количество баров) для каждого окна таймфрейма Всплывающее оповещение/звуков
FREE

Indicator designed for both beginners and professionals. This indicator will help you: reduce the number of errors when opennig orders; predict price movement(in absent of significant news); do not rush to close profitable trades prematurely and increase profit; do not rush to enter the market and wait for "easy prey": and increase the profitability of trading. BUY and SELL signals, ALARM and PUSH - https://www.mql5.com/ru/market/product/127003
FREE

The Starting Points indicator for MetaTrader 4 is a technical analysis tool that shows the monthly, weekly, and daily starting points, as well as the 1000-point and 500-point levels, in the forex market. The indicator is displayed as a series of horizontal lines that represent the starting points and levels. Benefits of Using the Starting Points Indicator Identify potential trend changes: The Starting Points indicator can help traders identify potential trend changes by highlighting areas wher
FREE

Данный индикатор позволяет узнать сколько цена может пройти на текущем баре. Он выискивает среднее значение ATR для предыдущих 5 баров и рисует 2 границы цены. Вы можете его использовать на любом таймфрейме любого инструмента. На основе этого индикатора можно выставлять уровни стоп лосса и и профита, а также использовать его и в других хороших стратегиях. Не забывайте пользоваться риск менеджментом во время торговли!
FREE

Индикатор теней.
Отображает размер теней свечей, в пунктах, в виде гистограммы. Работает в трех режимах, на выбор пользователя. Описание настроек индикатора Mode - режимы работы индикатора, три режима: первый height - режим отображения верхних и нижних теней свечей; второй difference - режим отображения разницы теней свечей, разница между верхней и нижней тенью свечи; третий superiority - накопленная разница теней свечей за один торговый день, режим не работает на периоде большем 4 часа.
FREE
Индикатор NearONE в подокне выбранного торгового инструмента отображает среднее значение отклонения цены в пунктах за указанный период.
Входные параметры : DRAWs - количество баров для отображения индикатора; NearPeriod - расчетный период индикатора.
Параметр NearPeriod может быть со значением 0 , тогда используются рекомендованные периоды для каждого из таймфреймов графика.
При NearPeriod = 0: Таймфрейм M1 - период = 60 ; Таймфрейм M5 - период = 48 ; Таймфрейм M15 - период = 96 ; Таймфрейм M
FREE
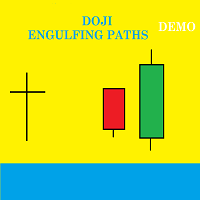
Общие сведения Индикатор Doji Engulfing Paths отображает на графиках сигналы и данные о дожи и паттернах "Поглощение". Это позволяет следовать за трендом на форексе и биржах. Вы можете использовать все возникающие торговые возможности как при сигнале разворота, так и при сигнале продолжения тренда. В этой демо-версии сигналы доступны только с двадцатой свечи.
Особенности Благодаря быстрому исполнению индикатор позволяет получать информацию о новых паттернах дожи на графике, начиная с последней
FREE

CFN - Multi MA & EMA Indicator for MT4 – with Alerts Enhance your technical analysis with the Multi MA & EMA Indicator – a powerful tool designed for traders who rely on Moving Averages and Exponential Moving Averages to spot trends, entries, and exits. Key Features: Supports up to 5 Moving Averages (MA) & 5 Exponential Moving Averages (EMA):
Plot multiple MAs and EMAs simultaneously on your chart, fully customizable with individual periods. Custom Colors & Styles:
Each MA and EMA l
FREE
MetaTrader Маркет - уникальная площадка по продаже роботов и технических индикаторов, не имеющая аналогов.
Памятка пользователя MQL5.community расскажет вам и о других возможностях, доступных трейдерам только у нас: копирование торговых сигналов, заказ программ для фрилансеров, автоматические расчеты через платежную систему, аренда вычислительных мощностей в MQL5 Cloud Network.
Вы упускаете торговые возможности:
- Бесплатные приложения для трейдинга
- 8 000+ сигналов для копирования
- Экономические новости для анализа финансовых рынков
Регистрация
Вход
Если у вас нет учетной записи, зарегистрируйтесь
Для авторизации и пользования сайтом MQL5.com необходимо разрешить использование файлов Сookie.
Пожалуйста, включите в вашем браузере данную настройку, иначе вы не сможете авторизоваться.