ADR ST Patterns
- Indicadores
- Versión: 1.0

ADR ST patterns es una modificación del indicador ADR clásico. Este sencillo indicador se corresponde con los parámetros especificados en la Estrategia de patrones ST(https://stpatterns.com/). Los patrones ST son el propio mercado, que se divide sistemáticamente en componentes. Para la formación de los patrones ST no se necesitan líneas de tendencia, proporciones geométricas del propio modelo, volumen de negociación o interés de mercado abierto. Se reconocen fácilmente y se construyen sólo sobre la base de la ruptura de los niveles fractales y la distancia al Objetivo. Los patrones ST eliminan del mercado la incertidumbre inherente a las composiciones gráficas conocidas hasta ahora y simplifican el trabajo del operador.
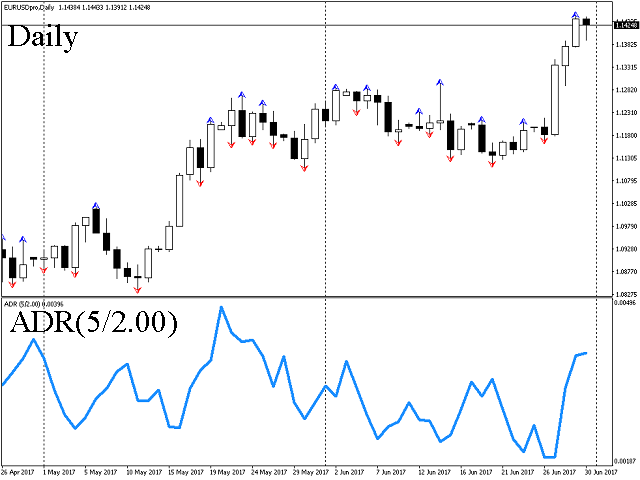
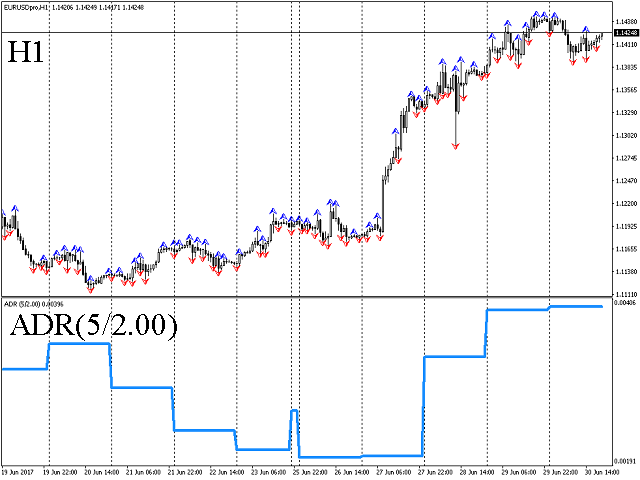
El indicador calcula el rango medio diario de los días de negociación completados y divide este valor por una cantidad determinada. El resultado se muestra en forma de gráfico en una ventana independiente. Es posible utilizar el indicador en varios horarios.
Este sencillo indicador corresponde a los parámetros especificados en la Estrategia de patrones ST.
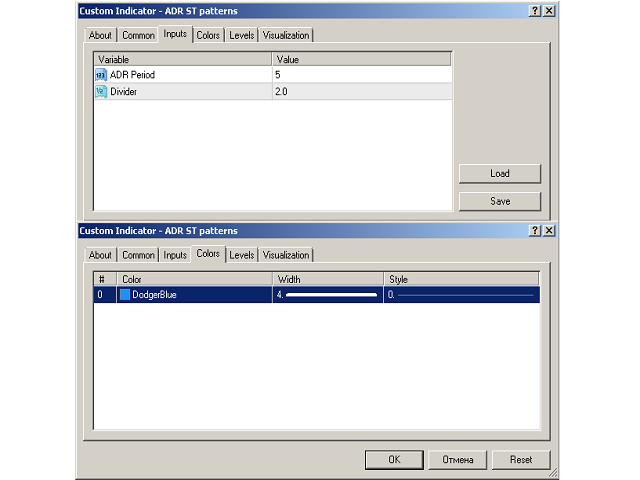
Entradas
- Período ADR - número de días utilizados para calcular el promedio;
- Divisor - divisor, al que se divide el ADR.
El color y el tamaño del gráfico se pueden configurar en la pestaña Colores.

С января торгую по этой системе. Пользуюсь обоими индикаторами. Простые и удобные. Автору респект за систему и индикаторы.