Review Candle Chart Trial for MT4
- Indicadores
-
Yutaka Okamoto
 I specialize in developing high-quality indicators for both MT5 and MT4 platforms.
With a strong background in programming and a keen eye for market analysis,
I strive to create innovative and effective tools that help traders make informed decisions and achieve success in their trading journey. - Versión: 1.11
- Actualizado: 23 febrero 2021
ReviewCandleChart es un producto único que puede verificar las fluctuaciones de precios en el pasado utilizando gráficos de velas.
Este indicador reproduce con precisión las fluctuaciones de los precios del mercado en el pasado y puede tomar decisiones comerciales (entradas, ganancias, corte de pérdidas) muchas veces para que pueda aprender el comercio más rápido.
ReviewCandleCahrt es el mejor indicador para mejorar las habilidades de negociación.
RevisiónCandleCahrt abastece tanto a los principiantes y los comerciantes avanzados.
Ventajas del indicador
- Este indicador para verificar la fluctuación de precios utilizando gráficos de velas.
- Sincronizar con el mismo par de divisas. -> Añadido ajuste "Sincronización entre diferentes pares de divisas" en la versión de pago.
- Al igual que con los datos musicales (mp3), puede adelantar, pausar o saltar y desplazarse a los datos de precios que desee comprobar.
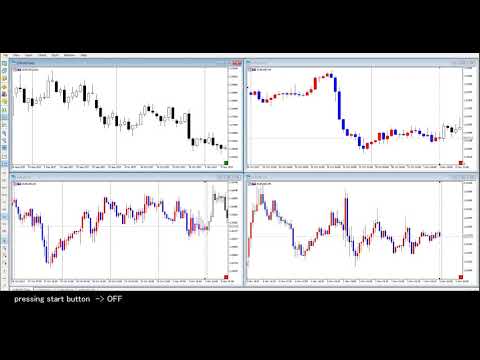
- Cuando el botón de inicio está activado, no se dibujará la vela a la derecha de la línea de base.
- La sincronización es posible moviendo la línea de referencia incluso cuando el botón de inicio está apagado, dependiendo de la configuración.
ReviewCandleChart (Trial) para MT4- es una versión demo, que funciona sólo en el par de divisas AUDUSD. Algunas funciones están restringidas.
La versión ilimitada se puede comprar aquí: https://www.mql5.com/ja/market/product/26406
Cómo utilizar el producto
Después de pulsar el botón de inicio
Se muestra la línea de base vertical. Muévala con el ratón para sincronizar otros gráficos. Puede seleccionar y deseleccionar la línea de base vertical con doble clic.
Teclas de uso
- Tecla R
- Tecla L
- Tecla F
- Tecla Z o X
- 4 ó 6 ó 5 (tecla Numlock) <- La versión de prueba no funcionará
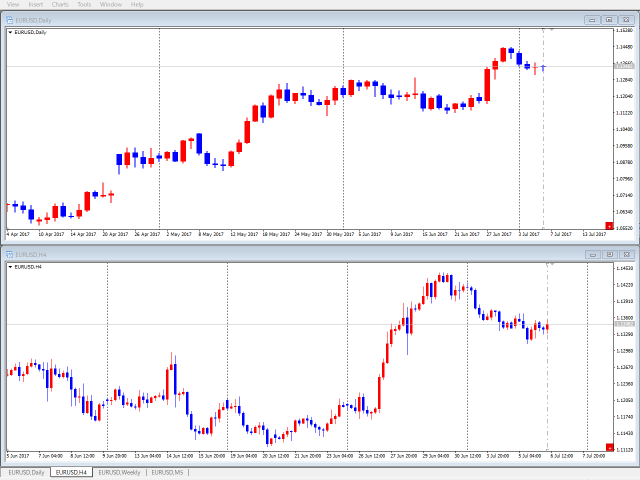
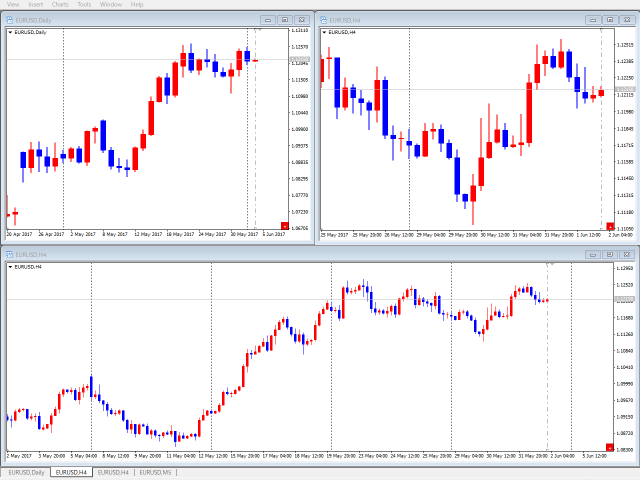
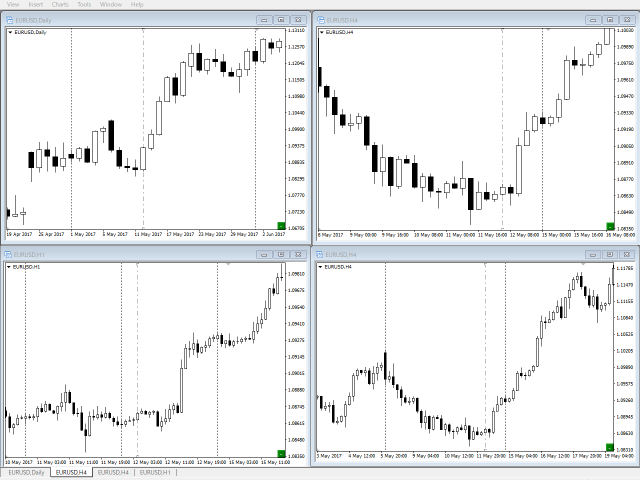
Sincronización de múltiples marcos temporales. Al mover el gráfico, dibuje velas de los pares de divisas sincronizados. Si el gráfico movido está en el período inferior, dibuje una vela basada en el precio dibujado en ese período.
Antes de pulsar el botón de inicio
Utilice las teclas
- Tecla L
- Tecla T + pulsar el botón de inicio <- La versión de prueba no funcionará
Parámetros del indicador
- línea vertical base
- siempre activada - Se muestra cuando el botón de inicio está desactivado - [false]
- color - [Gris]
- estilo - [Dashdot]
- ancho - 2 a 4 sólo son válidos para Estilo sólido - 1 a 4 - [1]
- Desplazamiento a la derecha(>=0) - Establece la posición de visualización del candelero en el extremo derecho - [1]
- vela
- color vela bajista - color oso - [Azul]
- colorvela alcista - color alcista - [Rojo]
- color doji - [Negro]
- max bar counts (limit) - Número máximo de barras a calcular. Ver la nota - [100000]
- teclas de entrada - Funcionamiento de las teclas
- Step count - Número de barras a mover de una vez - 1 o más - [1]
- siguiente - Mover a la derecha - [Tecla_X]
- atrás - Mover a la izquierda - [Key_Z]
- redisplay - Mover el gráfico a la línea base - [Key_R]
- línea base - Mover la línea base a la posición del gráfico mostrado - [Tecla_L]
- futuro - Mostrar / ocultar la vela a la derecha de la línea de base - [Tecla_F]
- botón de inicio
- esquina del botón - Posición del botón - Inferior derecha o inferior izquierda - [Inferior derecha]
- margenx - Margen horizontal - 0 o más - [0]
- margeny - Margen vertical - 0 o más - [15]
- Línea de precio BID
- enabled - Mostrar activado - [true]
- color - [Plateado]
- estilo - [Sólido]
- ancho - 2 a 4 sólo son válidos para Estilo sólido - 1 a 4 - [1]
Nota
Establecer el número máximo de barras de visualización.
Menú Herramientas>Opciones>Pestaña Gráficos > Número máximo de barras en el gráfico:
Ajuste el indicador al mismo valor o a un valor menor que el valor de ajuste de "Barras máximas en el gráfico:".
Entradas>Candlestick>Máx barras (límite)
Por favor, ajuste el valor de acuerdo con el rendimiento de su PC.
Si no hay datos de precios, se mostrará un mensaje de error.
>no se encontraron datos[AAAA.MM.DD] datos anteriores
Desarrollador
Yutaka Okamoto, programador profesional.