Pan PrizMA
- Indicadores
-
Aleksey Panfilov
 .
.
Bienvenido!
Sugiero probar y evaluar los indicadores construidos en base рекуррентного cálculo. Matemático de la base aquí: http://dxdy.ru/post1247421.html#p1247421 - Versión: 1.3
- Actualizado: 31 marzo 2020
- Activaciones: 20
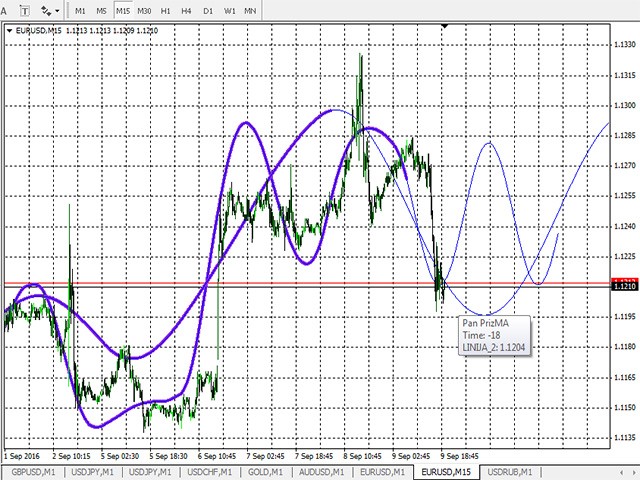
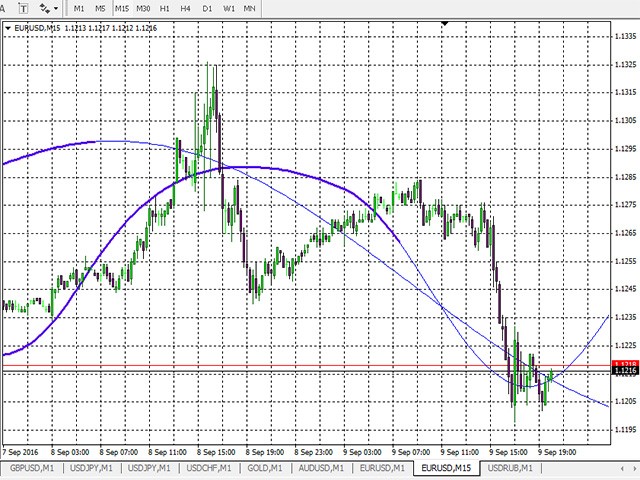
Como mínimo, este indicador es capaz de entretenerle. Construye una línea móvil basada en la interpolación por un polinomio de 1-4 potencias y/o una función consistente en una suma de 1-5 curvas seno. Son posibles varias combinaciones, por ejemplo, una suma de tres curvas seno sobre una parábola de segundo orden. La línea resultante puede extrapolarse mediante cualquiera de las funciones especificadas y para varias distancias, tanto como un único punto en cada paso del indicador (línea inmutable), como un segmento de función especificado (repintado) para su visualización.
El indicador consta de cuatro líneas. Cada línea sucesiva del indicador se basa en los resultados de una anterior. Cada línea, excepto la primera, puede ser de promediación o de extrapolación en función de una dirección especificada: (-1) - promediación o (1) - extrapolación.
Interpolación lineal
Necesitamos al menos dos puntos para una línea recta, tres puntos para una parábola cuadrada, cuatro para una parábola cúbica, etc.
Una recta es una progresión aritmética que permite obtener un tercer punto después de los dos primeros:
E3 = (E2-E1)+E2 = 2*E2 - E1 es una ecuación de diferencia de primer orden para puntos equidistantes (similar a la ecuación tras la reducción de todos los cocientes de las ecuaciones de Lagrange).
Interpolación trigonométrica
Utilice la ecuación del seno de ángulo doble: Sin 2a = 2 * Cos a * Sin a. Podemos probar su validez geométricamente como Sin 2a = 2 * Cos a * Sin a - 0 y Sin 3a = 2 * Cos a * Sin 2a - Sin a, etc., donde Cos a es un coseno angular de un paso, mientras que Sin es de hecho el valor apropiado de la gráfica. En ese caso, una ecuación de diferencia de primer orden para la curva seno alrededor de cero se ve como sigue: E3 = 2 * Cos a * E2 - E1. Aquí podemos ver una analogía perfecta con la ecuación de la línea recta. En el indicador, la transición de ecuaciones trigonométricas a lineales se realiza asignando el período igual a uno. Cos 360 es igual a 1 convirtiendo la ecuación en lineal.
Variables externas (tomando como ejemplo las dos primeras líneas)
- line_1_power =12 - potencia de la línea interpolante. Para la función trigonométrica, la potencia 2 corresponde a una sola curva seno alrededor de la constante. La potencia 3 corresponde a una única curva seno alrededor de la recta inclinada. La potencia 4 corresponde a una única curva seno alrededor de la parábola cuadrada, o a dos curvas seno alrededor de la constante, etc. En este caso, la potencia 12 en los seis períodos especificados a continuación corresponde a la función compuesta por 6 sinusoides en torno a la constante.
- line_1_leverage =10 - palanca de interpolación. Equivale al período de alisamiento. En particular, la línea de interpolación por la potencia de uno corresponde plenamente a EMA estándar con un valor de período doble.
- line_1_interval =1 - intervalo entre puntos adyacentes utilizado en el cálculo (no confundir con el apalancamiento). En particular, la línea recta conecta tres puntos (dos de ellos son adyacentes, mientras que el restante se encuentra a la distancia de apalancamiento).
- line_1_period_1=6 - período de la curva sinusoidal si la función es trigonométrica. Si la función es lineal, se establece el valor 1.
- line_1_period_2=7,5
- line_1_period_3=10
- período_de_línea_1_4=20
- período_de_línea_1_5=60
- line_1_period_6=240
- line_1_shift =0 - desplazamiento de la línea indicadora. Los valores positivos se desplazan hacia la derecha y los negativos hacia la izquierda. Por defecto, las líneas se trazan considerando el desplazamiento de apalancamiento.
- XXXXXXXXXXXXXXXXXXXXXX1=2 - separador de parámetros de diferentes líneas, para mayor claridad.
- line_2_trend =1 - dirección de cálculo de la línea: (-1) - suavizado, (1) - extrapolación.
- line_2_power =10 - interpolación de la potencia de la línea. Si el resto de parámetros son similares a los de suavizado, la segunda línea pasa por el último punto de apertura de la barra. Las potencias 1001, 1002, 1003-1009, 1010 extrapolan el segmento de función. El segmento de función se vuelve a pintar en cada barra y sólo es necesario para la visualización.
- line_2_leverage =8 - apalancamiento de interpolación, en cada valor el indicador dibuja un punto a la distancia de este apalancamiento, que no se vuelve a dibujar durante la formación de la barra, ya que se basa en el precio de apertura. En caso de potencias 1001, 1002, 1003-1009, 1010, establece la línea de segmento de función trazada.
- line_2_interval =1 - intervalo entre puntos adyacentes utilizado en el cálculo.
- line_2_period_1 = 6 - período de la curva sinusoidal si la función es trigonométrica. Si la función es lineal, se establece el valor 1.
Puede haber combinaciones de parámetros externos que alejen la línea del precio actual (valores de potencia elevados, apalancamiento grande, combinación inadecuada de una curva sinusoidal y un apalancamiento). No se trata de un error del programa. Lo más sencillo es abrir un inicio de gráfico y examinar la línea. Por ejemplo, la interpolación mediante un polinomio mayor que la cuarta potencia es matemáticamente posible. Sin embargo, la amplitud de oscilación de la línea suavizada crece rápidamente asemejándose a una resonancia.