Pon "Me gusta" y sigue las noticias
Deje un enlace a él, ¡qué los demás también lo valoren!
Evalúe su trabajo en el terminal MetaTrader 5
- Visualizaciones:
- 31773
- Ranking:
- Publicado:
- Actualizado:
-
¿Necesita un robot o indicador basado en este código? Solicítelo en la bolsa freelance Pasar a la bolsa
Author:
Julien L (http://www.thetradingtheory.com)
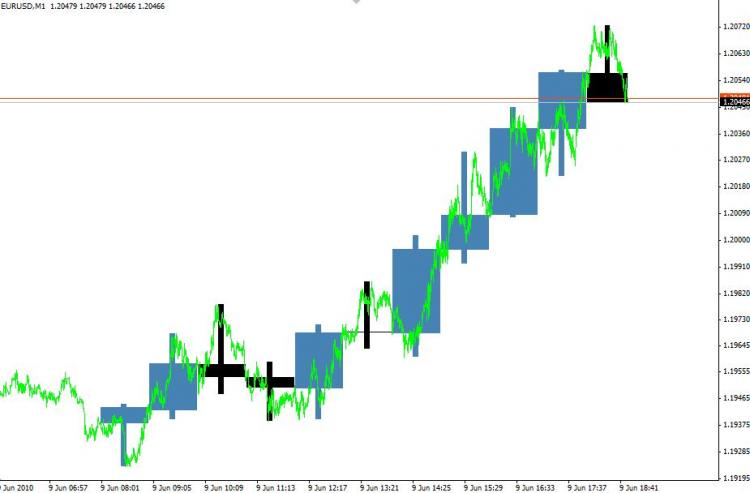
I wanted to know the details of the candles. What's happening in those H1 candles? By switching to a lower timeframe, you don't have the same view, making it hard to understand what gives their shapes to the candles.
So I've created this indicator, that draws candles from an higher timeframe on your chart.
If you wanna see all the details in your H1 candles, just apply this indicator on M1!
Recommendations:
- drawing.mq4 must be placed and compiled in the experts/libraries/ folder.
You can find more details and more researches on my blog: www.thetradingtheory.com
 Progressive Grid Positionning System (Entry and Exit)
This systems allows you to progressively enter and exit the market. You define the amount you want to risk (%) and it calculates automatically the different levels of entering and exiting the market according to the amount of levels you have defined.
 Drag and Drop Support and Resistance "segment lines" with color differentiation
Draw several resistance and support lines as a "little segment line", differentiating the color of both types of line
 DROP LEVEL LINES (WITH LEVEL VALUE AND AUTOMATIC COLOR CHANGING)
Drop Level Lines with the level value inserted above or below the line and the color changing automatically for bottom level or top level.
 Trinity-Impulse
Zero values characterizes the Flat Trend. V-shaped pulse indicates the entrance to the opposite direction. U-shaped ilpuls - entry in the same direction.
