Pon "Me gusta" y sigue las noticias
Deje un enlace a él, ¡qué los demás también lo valoren!
Evalúe su trabajo en el terminal MetaTrader 5

Horizontal Grid Lines on Chart - indicador para MetaTrader 4
- Visualizaciones:
- 48408
- Ranking:
- Publicado:
- Actualizado:
-
 Está perdiendo oportunidades comerciales:
- Aplicaciones de trading gratuitas
- 8 000+ señales para copiar
- Noticias económicas para analizar los mercados financieros
Registro EntradaUsted acepta la política del sitio web y las condiciones de uso
Si no tiene cuenta de usuario, regístrese -
 ¿Necesita un robot o indicador basado en este código? Solicítelo en la bolsa freelance
Pasar a la bolsa
¿Necesita un robot o indicador basado en este código? Solicítelo en la bolsa freelance
Pasar a la bolsa
15 Sep 2010 - Version 2
GRID10 is an indicator which will draw a grid on a chart using grid lines separated at a convenient power of ten. I have updated this indicator with the following features:
1 - The optional ability to include intermediate grid lines every 10%, 20%, 25% or 50% of the major grid lines.
2 - The resolution of the grid is now tied to the range of the chart (rather than the range of the data on the chart). This means that if the chart is resized, the grid will automatically resize with it at the next tick. (You can resize the chart by right-clicking in the margin to the right of the chart, and dragging the mouse up or down accordingly.)
3 - Correction to odd results caused by use of MathMod API function. (See the code for details of this fix if you're interested.)
")
Instructions
Choose the symbol you're interested in and display it in a chart window.
Select Ctrl-G to erase the default grid. Or, right-click on the chart, select properties, choose common, and then uncheck show grid.
Download and compile the Grid10.mq4 code and load Grid10 Custom Indicator to your chart.
It will automatically scale according to the range of the chart you have placed it upon.
Optionally, choose whether you require intermediate grid lines and, if so, their frequency.
| Intermediate Line Percentage(%) |
Number of Sub-divisions between gridlines |
|---|---|
| 0 | - |
| 10 | 10 |
| 20 | 5 |
| 25 | 4 |
| 50 | 2 |
Optionally, choose your colour scheme and line style properties for the grid and intermediate lines.
At your will, resize the chart (right click in chart margin and drag mouse).

That's it!
Hope you like it, MOOSE.
10 Sep 2009 - Version 1
I have found the horizontal grid lines displayed on MT4 charts to be somewhat arbitrary and a touch confusing.
So I developed this indicator, GRID10, which will automatically display horizontal grid lines on a chart positioned and separated at a convenient power of ten according to the range of the symbol plotted on the chart.
Consider the chart of an index, say S&P 500, ranging in value from less than 800 to greater than 1000. Imagine how convenient it would be to have horizontal grid lines placed on the chart at 800, 900 and 1000 to aid interpretation of data.
 S&P 500 Chart with Grid10
Consider a currencey pair, say AUDCAD, where the range of the chart is considerably less than 0.1. In this case, grid lines will be drawn at intervals of 0.01.
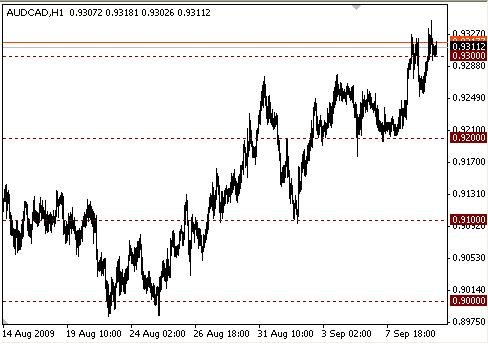 AUDCAD Chart with Grid10
The grid lines will automatically re-adjust in the event of the chart being resized to change either the number of bars displayed or the absolute range of the symbol being plotted.
This is my first post on this forum and I hope you find the indicator to be of use.
Regards, MOOSE.
 GetPaneHeights
This function calculates the heights in pixel of all panes in a window.
 HistoryTraning (NEW VERSION)
The adviser allows you to try manual trading on the historical date (NEW VERSION / BUGS CORRECTED / NEW FUNCTIONS ADDED)
iVeryCoolSpectrometr
Цветной анализатор спектра
Working inside the channel
The indicator with market entry signals and stop lines