Lorentzos Roussos / Profile
- Information
|
11+ years
experience
|
11
products
|
298
demo versions
|
|
220
jobs
|
0
signals
|
0
subscribers
|
🎱🏓🎷💚☕️
💎 The simplest Neural Network Coding Guide : https://www.mql5.com/en/blogs/post/752324
💎 The simplest DLL for mql5 Coding Guide : https://www.mql5.com/en/blogs/post/753426
💎 Harmonic patterns scanner for MT5 : https://www.mql5.com/en/market/product/51212
💎 Similar price action candlestick patterns indicator for MT5 : https://www.mql5.com/en/market/product/133318
💎 Fibonacci Sonar indicator : https://www.mql5.com/en/market/product/133627
💎 Chart projection indicator : https://www.mql5.com/en/market/product/5569
💎 Youtube : https://www.youtube.com/@lorentzor1938
Lorentzos Roussos
Published code Download all ticks of a symbol's history
Download all the ticks from your broker for all the symbols in the market watch.
Download all history or until a specific date in the past if available.
Share on social networks · 1
5731
658
Lorentzos Roussos


Here is how the liquidity pools of uniswap work on chain : Assume we are on the ethereum chain . We will assume euro and usdollar are 2 memecoins for which we want to create a liquidity pool. Why ? Because it will be easier to draw parallels with forex pairs...
Share on social networks · 2
258
5
Lorentzos Roussos


How to leverage crypto to revamp the mql5 community , and drive more traffic .(more traffic = more commissions) A.The blockchain : Pick an EVM chain with low fees : Avalanche Arbitrum Polygon Binance Smart Chain B.Deploy 3 token contracts ,2 with "minting for" functionality . one as a "reward...
Share on social networks
144
2
Rajesh Kumar Nait
2024.03.08
i believe you should post these great improvement suggestions on Russian forum. As per one moderator Alan comment which I read in past, there is zero visibility of MQL admins on English forum
Lorentzos Roussos
Published code Cosine distance and cosine similarity
Calculate the cosine distance and similarity between 2 vectors .
The cosine distance is 1-cosine_similarity
and
the cosine similarity is the dot product of two vectors by their magnitudes multiplied.
Share on social networks · 1
3284
244
Lorentzos Roussos


Lets open up ms paint and draw a cluster . This is an upscale image of a 60x60 manually drawn bmp file This file will be fed into our code and the code will have to transform it so that the direction with the biggest variance sits on the x axis (if i understood things right...
Lorentzos Roussos


First what is it ? Secondly some docs Wikipedia page We will need : Covariance matrix Matrix inversion Matrix multiplication Vector mean The matrix and vectors library mql5 has covers all of our needs actually...
Lorentzos Roussos


Thread Swarm with leader and global variables , for 1 terminal
13 December 2023, 14:14
Let's assume you have data that must be downloaded on a server . This data concerns multiple symbols not just one and you are not making one request per symbol separately...
Lorentzos Roussos


If you have a Dell monitor :
Brightness 14
Contrast 20
Red 91
Green 79
Blue 52
You are welcome
💚☕️
Brightness 14
Contrast 20
Red 91
Green 79
Blue 52
You are welcome
💚☕️
Show all comments (5)
Lorentzos Roussos


Conor Mcnamara
2024.08.08
the moment you realize life would have been different if you set a Buy Stop order
Lorentzos Roussos
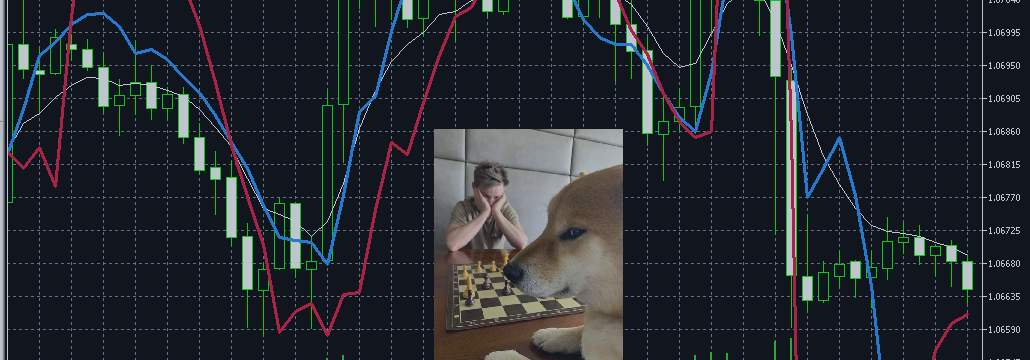

Weirdness , Trying to guess price action with a moving average and 4 deltas
14 November 2023, 14:40
Coffee Will examine and test a rather silly idea Let's set up some base rules first We have a constant moving average called the spine We measure the high and low distance to that spine We keep 2 averages going for those distances a fast and a slow Having in total 5 averages (with the spine) That...
Lorentzos Roussos


Can you backtest renko charts ? ☕️
Lorentzos Roussos
2023.11.16
Thanks , MT4 ? Uh-oh . Is it built on live ticks alone or a collection of real ticks ?
god333
2023.11.16
:) Do you know the legendary poor quality of MT4 ticks?
I won't be able to answer you but you can imagine that it can't be terrible. On the other hand, here is how I see this mediocre tool: If I'm looking for a profitable strategy or out of simple curiosity I first test on time frames of 15 or 5 minutes. If the strategy works or my curiosity is satisfied I already consider it extraordinary compared to manual trading. Then if the stakes are worth it and the strategy can work in shorter UTs I will probably switch to MT5 or something else. You will therefore conclude that this has never happened to date. The ''RENKO style'' strategy was not a great success. Maybe there are errors on my part or other indicators to add. To have. I no longer have the exact reason for my disappointment with the coding of my strategy in RENKO equivalent but it didn't work like on paper. So whatever the quality of the data, it was not at fault or only partially. I did not have the availability to dig in and better exploit this robot and insist on the RENKO equivalent as a strategy but I will surely come back to it at the beginning of 2024 when I have more availability because on paper it had potential. I will contact you by message for the code.
I won't be able to answer you but you can imagine that it can't be terrible. On the other hand, here is how I see this mediocre tool: If I'm looking for a profitable strategy or out of simple curiosity I first test on time frames of 15 or 5 minutes. If the strategy works or my curiosity is satisfied I already consider it extraordinary compared to manual trading. Then if the stakes are worth it and the strategy can work in shorter UTs I will probably switch to MT5 or something else. You will therefore conclude that this has never happened to date. The ''RENKO style'' strategy was not a great success. Maybe there are errors on my part or other indicators to add. To have. I no longer have the exact reason for my disappointment with the coding of my strategy in RENKO equivalent but it didn't work like on paper. So whatever the quality of the data, it was not at fault or only partially. I did not have the availability to dig in and better exploit this robot and insist on the RENKO equivalent as a strategy but I will surely come back to it at the beginning of 2024 when I have more availability because on paper it had potential. I will contact you by message for the code.
Lorentzos Roussos


Besides lucky and unlucky theres easy luck and hard luck .
Let's say you buy a pair , and it goes down (trade 1) VS buying a pair -> it arrives one _Point before your take profit level and then goes down (trade 2). Both those trades hit stop loss .
Now let's say you are optimizing this strategy . The more pointers toward an outcome you leave inside the "virtual environment" for the genetic algorithm the more the genetic algorithm will consider the outcome.I call this making the terrain more "walkable".
So , if you are formulating the reward yourself , and , the reward varies between -1.0 -> +1.0 , are these 2 trades equally bad ? Are they both -1 ? I mean if one day you make pizza and you burn it but the other day you make pizza you taste one piece and its good but your girlfriend steals it from you , breaks up with you and leaves (with the pizza) does that mean you will discard both pizza recipes and start over ?☕️
Yashar Seyyedin
2023.11.10
Great! Also: Unfortunately what you get as a chart has no integrity by itself. Almost meaningless to optimize. Optimization tool is only good to test how much a trading logic depends on parameters' calibration and evaluate its reliability when market atmosphere changes.
Lorentzos Roussos
2023.11.10
you mean the chart comes in with a preselected parameter , the timeframe
Lorentzos Roussos


here are some numbers from the front page of the popular products for MT5
⚠️The average publication date is 9th December 2022
⚠️78% of products have at least one backtest screenshot
⚠️64% of products have a live signal
⚠️The average duration of the signals is 30 weeks
⚠️The average price is 972 $
⚠️64% of products will increase the price after some sales , or the price is a discount
⚠️Theres almost 61 reviews per product with 202 comments and 3170 demo downloads
⚠️36% is using keywords for ai , neural networks , intelligence gpt etc
⚠️You can get an idea of what the product is from the logo in 8% of cases , and from the title in 19%
Interesting observations :
There's products that have fresh live signals but were not published recently
There's an ea that uses chat gpt (which came out 2023) but showcases a backtest from 2019
There's an ea sporting a funded challenge certificate which links out to a different name than the sellers BUT that name appears to be his/hers employee . The employee also has an mql5.com account and has not posted a review on any of the products . Honorable mention . i got curious 😂😂😂🍻

Lorentzos Roussos
2023.11.09
Also many of the products that have no "FOMO" now did in the past and got to the top . So that number is higher . So the sellers kinda hit the "fair price" the market is willing to pay for their product , stopped the "next price" and are not planning the next scam . i mean the next ai trading algorithm sorry
Lorentzos Roussos


Market History of product price available as a graph at the bottom of the overview or accessible by a "Show Price History" button under the buy choices . Every price change by the vendor creates a new data point on the graph with a date and a price...
Lorentzos Roussos
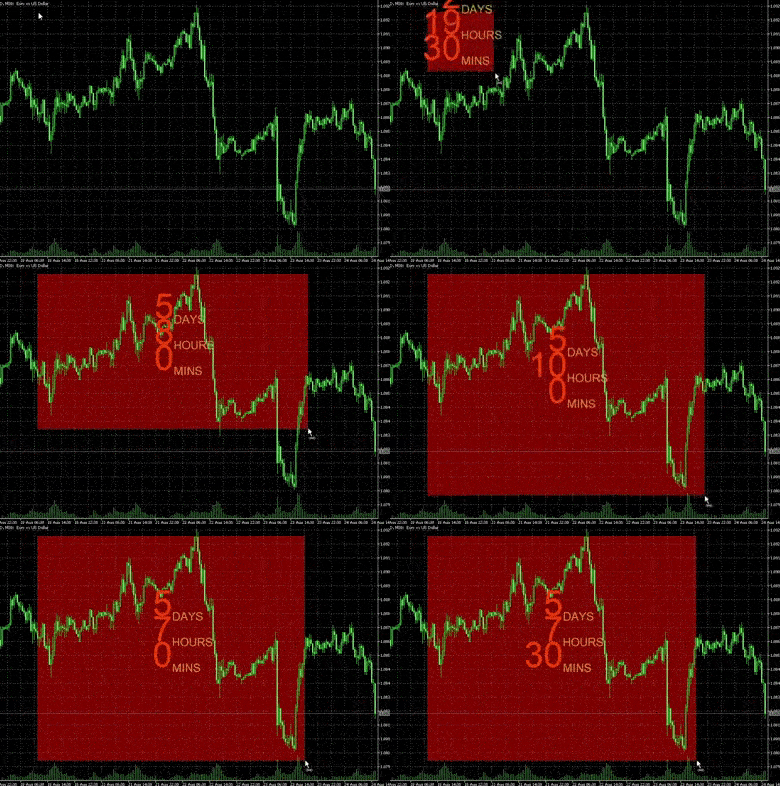
calendar crosshair MT5 for coding warm up . 😊☕️☕️
get it here https://www.mql5.com/en/forum/452930#comment_48934644
get it here https://www.mql5.com/en/forum/452930#comment_48934644

Lorentzos Roussos


[Deleted]
2023.09.23
wow
Lorentzos Roussos


Hi! First things first you need visual studio for this . Install it , start it up...
Share on social networks · 7
1255
25
Lorentzos Roussos
Published post Cyprus DST shifts from 2000 till 2028
If your broker is in Cyprus If your brokers server time is in Cyprus's Time Zone You can use the following structures to turn historical bar times or historical ticks to gmt time #property copyright "Source" #property link " https://www.mql5.com/en/blogs/post/753335 " #property version "1...
Lorentzos Roussos


In this blog i'm exloring how the local memory operates with regard to a work group (of work items). We create a simple kernel that will export IDs , global id, local id, group id of a work item...
Lorentzos Roussos

Hi. Short version : 1.CLGetInfoInteger(kernel,CL_KERNEL_WORK_GROUP_SIZE) ; will give you the number of kernel instances that can run at the same time in the device (or the compute unit) (tested with 1CU gpu only) It will also be the max # of items in a group possible, 2...
:
