![OpenCL :: Exploring the 1st Dimension (incomplete series)[this has a lot of errors ,caution]](https://c.mql5.com/6/920/splash-752650-1683062575.png "OpenCL :: Exploring the 1st Dimension (incomplete series)[this has a lot of errors ,caution]")
OpenCL :: Exploring the 1st Dimension (incomplete series)[this has a lot of errors ,caution]

Hi.
Short version :
1.CLGetInfoInteger(kernel,CL_KERNEL_WORK_GROUP_SIZE); will give you the number of kernel instances that can run at the same time in the device (or the compute unit) (tested with 1CU gpu only) It will also be the max # of items in a group possible,
2.If 1 work dimension ,you can specify how many work items your work groups will have in with the optional highlighted array
bool  CLExecute(
   int          kernel,                   // Handle to the kernel of an OpenCL program
   uint         work_dim,                 // Dimension of the tasks space
   const uint&  global_work_offset[],     // Initial offset in the tasks space
   const uint&  global_work_size[],       // Total number of tasks
   const uint&  local_work_size[]         // Number of tasks in the local group
   );
-----------------------------Long version
This test will deploy a one dimensional "work" space with the native mql5 OpenCL commands available .
The task is to discover how to map local memory to work groups .
Frist let's create a simple test and try and gauge what the GPU does , or , how the GPU splits the workload without any instructions if you will.
I don't know if it means anything but that is what i'm trying to find out.
Must also keep in mind at all times and at every realization that this may be a specific reaction of this hardware so flexibility must be in place for others (you) to test it on your own .
OpenCL has some built in indexes that can be called from the kernel and will provide the
- Global id of the work item , for a dimension
- Local id of the work item , for a dimension
- Group id of the work item , for a dimension
So we can take advantage of these indexes and see how the groups are arranged if we dump a number of tasks on the GPU.
this is the kernel , the index calls have the dimension specified in parentheses
    string kernel="__kernel void memtests(__global int* global_id,"
                                         "__global int* local_id,"
                                         "__global int* group_id){"
                                         "global_id[get_global_id(0)]=get_global_id(0);"
                                         "local_id[get_global_id(0)]=get_local_id(0);"
                                         "group_id[get_global_id(0)]=get_group_id(0);}";
What this does is it receives 3 integer global memory arrays global_id , local_id , group_id and fills them up with the relevant index at the global position . For example if we had 10 oranges in 2 bags we would assign the bag index to the linear array index of oranges .
We would say , Orange[0] is in Bag0 and Orange[9] is in Bag1 , we would not use the index of the orange in the bag (Orange[0] is in Bag0 and Orange[4] is in Bag1) that would tell us nothing about how the oranges were arranged!
Hence the use of get_global_id(0) to store all ids.
We do all the boring and annoying OpenCl prep stuff , how the program runs , when its called , buffers kernels contexts and we provide one parameter for how many items or oranges to throw to the test.
this is how the code looks :
#property version   "1.00"

int OnInit()
  {
//---
  EventSetMillisecondTimer(33);
//---
   return(INIT_SUCCEEDED);
  }

void OnDeinit(const int reason)
  {
//---

  }
void OnTimer(){
  EventKillTimer();
  int ctx=CLContextCreate(CL_USE_GPU_DOUBLE_ONLY);
  if(ctx!=INVALID_HANDLE){
    string kernel="__kernel void memtests(__global int* global_id,"
                                         "__global int* local_id,"
                                         "__global int* group_id){"
                                         "global_id[get_global_id(0)]=get_global_id(0);"
                                         "local_id[get_global_id(0)]=get_local_id(0);"
                                         "group_id[get_global_id(0)]=get_group_id(0);}";
    string errors="";
    int prg=CLProgramCreate(ctx,kernel,errors);
    if(prg!=INVALID_HANDLE){
    ResetLastError();
    int ker=CLKernelCreate(prg,"memtests");
    if(ker!=INVALID_HANDLE){
    int items=2560;
    int global_ids[];ArrayResize(global_ids,items,0);
    ArrayFill(global_ids,0,items,0);
    int local_ids[];ArrayResize(local_ids,items,0);
    ArrayFill(local_ids,0,items,0);
    int group_ids[];ArrayResize(group_ids,items,0);
    ArrayFill(group_ids,0,items,0);
    int global_id_handle=CLBufferCreate(ctx,items*4,CL_MEM_WRITE_ONLY);
    int local_id_handle=CLBufferCreate(ctx,items*4,CL_MEM_WRITE_ONLY);
    int group_id_handle=CLBufferCreate(ctx,items*4,CL_MEM_WRITE_ONLY);
    CLSetKernelArgMem(ker,0,global_id_handle);
    CLSetKernelArgMem(ker,1,local_id_handle);
    CLSetKernelArgMem(ker,2,group_id_handle);
    uint offsets[]={0};
    uint works[]={items};
    CLExecute(ker,1,offsets,works);
    while(CLExecutionStatus(ker)!=CL_COMPLETE){Sleep(10);}
    Print("Kernel finished");
    CLBufferRead(global_id_handle,global_ids,0,0,items);
    CLBufferRead(local_id_handle,local_ids,0,0,items);
    CLBufferRead(group_id_handle,group_ids,0,0,items);

    int f=FileOpen("OCL\\log.txt",FILE_WRITE|FILE_TXT);
    for(int i=0;i<items;i++){
       FileWriteString(f,"GLOBAL.ID["+IntegerToString(i)+"]="+IntegerToString(global_ids[i])+" : LOCAL.ID["+IntegerToString(i)+"]="+IntegerToString(local_ids[i])+" : GROUP.ID["+IntegerToString(i)+"]="+IntegerToString(group_ids[i])+"\n");
       }
    FileClose(f);
    int kernel_local_mem_size=CLGetInfoInteger(ker,CL_KERNEL_LOCAL_MEM_SIZE);
    int kernel_private_mem_size=CLGetInfoInteger(ker,CL_KERNEL_PRIVATE_MEM_SIZE);
    int kernel_work_group_size=CLGetInfoInteger(ker,CL_KERNEL_WORK_GROUP_SIZE);
    Print("Kernel local mem ("+kernel_local_mem_size+")");
    Print("Kernel private mem ("+kernel_private_mem_size+")");
    Print("Kernel work group size ("+kernel_work_group_size+")");

    CLKernelFree(ker);
    CLBufferFree(global_id_handle);
    CLBufferFree(local_id_handle);
    CLBufferFree(group_id_handle);
    }else{Print("Cannot create kernel");}
    CLProgramFree(prg);
    }else{Alert(errors);}
    CLContextFree(ctx);
    }
  else{
    Print("Cannot create ctx");
    }
  }
void OnTick()
  {
//---

  }
Highlighted are the items parameter and the export of the indices we received to a file .
Also this code prints 3 values :
- Kernel local memory size (i get 1)
- Kernel private memory size (i get 0)
- Kernel work group size (i get 256)
So let's start by throwing it 100 items.
GLOBAL.ID[0]=0 : LOCAL.ID[0]=0 : GROUP.ID[0]=0
..
GLOBAL.ID[99]=99 : LOCAL.ID[99]=99 : GROUP.ID[99]=0
This is what the file output looks like (above) and you can see it did not split the work load in any way.
The first thing that comes to mind is "does it have a decision mechanism internally?" for both the wrapper and the mql5 native commands when they get to call OpenCL commands . How will we know ? Let's make the kernel a bit "heavier" and also extract a float value .
Let's create a range of values from -2.6 to 2.6 and have it calculate the tanh of that x times and also change the array on the spot.
So we add a global float pointer to the kernel arguments
__global float* _tangent, Then we create a double array in our program fill it with random values in range -2.6 to 2.6
    float tangents[];ArrayResize(tangents,items,0);
    float range=5.2;
    for(int i=0;i<ArraySize(tangents);i++){
       float r=(((float)MathRand())/((float)32767.0)*range)-2.6;
       tangents[i]=r;
       }
Then create a buffer handle for openCL ,in this case the memory is read write not just write.(read write for the device not the host(us))
int tangents_handle=CLBufferCreate(ctx,items*4,CL_MEM_READ_WRITE);
And then link the buffer to the kernel arguments
CLSetKernelArgMem(ker,3,tangents_handle);
aaand (i wasted 2 hours here as i forgot to read back the buffer 🤣) so , don't forget to call buffer read when you want the data.
CLBufferRead(tangents_handle,tangents,0,0,items);
aaand add free buffer at the end otherwise it appears to be caching (smartly) the values
CLBufferFree(tangents_handle); Cool , now , we need to make it a bit more difficult by providing an iterations number as an argument.
This will loop the tanh calculation and for each result we will be summing up the tanh of the tangent float / iterations.
Neat.
In this case we need to add an argument in the kernel ,link the argument to the kernel and set the value :
"int iterations){"//kernel
int iterations=100;//mql5
CLSetKernelArg(ker,4,iterations);//set in kernel (not link)
And the kernel calculations , let's look up the index of OpenCL
                                         "float sum=(float)0.0;"
                                         "float of=(float)_tangent[get_global_id(0)];"
                                         "for(int i=0;i<iterations;i++){"
                                         "sum+=((float)tanh(of-sum))/((float)iterations);"
                                         "}"
                                         "_tangent[get_global_id(0)]=sum;"
- Set sum to 0.0;
- Set the initial value in private mem variable "of"
- loop to iterations
- sum up the tanh of the "of" minus the sum so far divided by the iterations.
- fill up the tangent array
Simple and let's set initial iterations to 100 and run the code again to see if it still produces 1 group.(and also print the result of the sum to debug)
This is the exported file :
GLOBAL.ID[0]=0 : LOCAL.ID[0]=0 : GROUP.ID[0]=0 : T[0]=0.7702
GLOBAL.ID[1]=1 : LOCAL.ID[1]=1 : GROUP.ID[1]=0 : T[1]=0.0282
GLOBAL.ID[2]=2 : LOCAL.ID[2]=2 : GROUP.ID[2]=0 : T[2]=0.9934
GLOBAL.ID[3]=3 : LOCAL.ID[3]=3 : GROUP.ID[3]=0 : T[3]=2.2652
GLOBAL.ID[4]=4 : LOCAL.ID[4]=4 : GROUP.ID[4]=0 : T[4]=-2.2026
...
GLOBAL.ID[96]=96 : LOCAL.ID[96]=96 : GROUP.ID[96]=0 : T[96]=-1.7437
GLOBAL.ID[97]=97 : LOCAL.ID[97]=97 : GROUP.ID[97]=0 : T[97]=-1.1011
GLOBAL.ID[98]=98 : LOCAL.ID[98]=98 : GROUP.ID[98]=0 : T[98]=0.4125
GLOBAL.ID[99]=99 : LOCAL.ID[99]=99 : GROUP.ID[99]=0 : T[99]=1.8560
Okay it works i think , and we still get no split . Let's jack up the iterations to 10000 but items stay 100.
Still one group
GLOBAL.ID[99]=99 : LOCAL.ID[99]=99 : GROUP.ID[99]=0 : T[99]=0.0905
Let's go nuts , 10 million iterations 100 items , that may be problematic for the float precision ? let's see
No , still one group although the gpu delayed a bit.
GLOBAL.ID[99]=99 : LOCAL.ID[99]=99 : GROUP.ID[99]=0 : T[99]=-2.4797
(it makes sense to not split in groups further as the loop of iterations is a big pile of calculations that require no memory back and forth so this is optimal for running in a processing element , but also i don't think it can split within the work item and the kernel is one work item instance if i'm not mistaken . Moving on.)
Cool , now let's return the iterations to 1000 and start testing with different item amounts.
Let's throw 200 items to it
Still one group
GLOBAL.ID[0]=0 : LOCAL.ID[0]=0 : GROUP.ID[0]=0 : T[0]=1.5756
GLOBAL.ID[1]=1 : LOCAL.ID[1]=1 : GROUP.ID[1]=0 : T[1]=-1.1957
GLOBAL.ID[2]=2 : LOCAL.ID[2]=2 : GROUP.ID[2]=0 : T[2]=0.6411
...
GLOBAL.ID[198]=198 : LOCAL.ID[198]=198 : GROUP.ID[198]=0 : T[198]=0.5839
GLOBAL.ID[199]=199 : LOCAL.ID[199]=199 : GROUP.ID[199]=0 : T[199]=-1.5742
Now let's throw 257 items !
GLOBAL.ID[0]=0 : LOCAL.ID[0]=0 : GROUP.ID[0]=0 : T[0]=2.0035
GLOBAL.ID[1]=1 : LOCAL.ID[1]=1 : GROUP.ID[1]=0 : T[1]=-0.0069
GLOBAL.ID[2]=2 : LOCAL.ID[2]=2 : GROUP.ID[2]=0 : T[2]=-0.8145
GLOBAL.ID[3]=3 : LOCAL.ID[3]=3 : GROUP.ID[3]=0 : T[3]=1.7880
...
GLOBAL.ID[255]=255 : LOCAL.ID[255]=255 : GROUP.ID[255]=0 : T[255]=0.2042
GLOBAL.ID[256]=256 : LOCAL.ID[256]=256 : GROUP.ID[256]=0 : T[256]=1.7910
Still no split.
How about 258 ? we get our first split !
GLOBAL.ID[0]=0 : LOCAL.ID[0]=0 : GROUP.ID[0]=0 : T[0]=-1.2919
GLOBAL.ID[1]=1 : LOCAL.ID[1]=1 : GROUP.ID[1]=0 : T[1]=-1.2212
...
GLOBAL.ID[127]=127 : LOCAL.ID[127]=127 : GROUP.ID[127]=0 : T[127]=-1.2222
GLOBAL.ID[128]=128 : LOCAL.ID[128]=128 : GROUP.ID[128]=0 : T[128]=1.9752
GLOBAL.ID[129]=129 : LOCAL.ID[129]=0 : GROUP.ID[129]=1 : T[129]=1.0197
...
GLOBAL.ID[255]=255 : LOCAL.ID[255]=126 : GROUP.ID[255]=1 : T[255]=1.9462
GLOBAL.ID[256]=256 : LOCAL.ID[256]=127 : GROUP.ID[256]=1 : T[256]=-1.9560
GLOBAL.ID[257]=257 : LOCAL.ID[257]=128 : GROUP.ID[257]=1 : T[257]=-0.9829
It split the work load in half in 2 groups !
Okay , so we have to find the criterion for the split , let's throw some numbers it likes 512 , 1024 , 2048 etc and log the outcomes.
512 : Splits in 2 groups again :
GLOBAL.ID[0]=0 : LOCAL.ID[0]=0 : GROUP.ID[0]=0 : T[0]=-0.3564
GLOBAL.ID[1]=1 : LOCAL.ID[1]=1 : GROUP.ID[1]=0 : T[1]=2.3337
...
GLOBAL.ID[255]=255 : LOCAL.ID[255]=255 : GROUP.ID[255]=0 : T[255]=-2.4480
GLOBAL.ID[256]=256 : LOCAL.ID[256]=0 : GROUP.ID[256]=1 : T[256]=2.3620
...
GLOBAL.ID[510]=510 : LOCAL.ID[510]=254 : GROUP.ID[510]=1 : T[510]=-2.2709
GLOBAL.ID[511]=511 : LOCAL.ID[511]=255 : GROUP.ID[511]=1 : T[511]=-0.3056
Also notice how convenient the local id is , its telling us the index in each group !
1024 : aha , it split into 4 groups now ! So is the maximum group size for this device 256 items ?
GLOBAL.ID[0]=0 : LOCAL.ID[0]=0 : GROUP.ID[0]=0 : T[0]=-0.7910
GLOBAL.ID[1]=1 : LOCAL.ID[1]=1 : GROUP.ID[1]=0 : T[1]=-0.7287
...
GLOBAL.ID[255]=255 : LOCAL.ID[255]=255 : GROUP.ID[255]=0 : T[255]=0.2203
GLOBAL.ID[256]=256 : LOCAL.ID[256]=0 : GROUP.ID[256]=1 : T[256]=1.4999
..
GLOBAL.ID[511]=511 : LOCAL.ID[511]=255 : GROUP.ID[511]=1 : T[511]=0.1762
GLOBAL.ID[512]=512 : LOCAL.ID[512]=0 : GROUP.ID[512]=2 : T[512]=-0.0072
...
GLOBAL.ID[767]=767 : LOCAL.ID[767]=255 : GROUP.ID[767]=2 : T[767]=-2.0688
GLOBAL.ID[768]=768 : LOCAL.ID[768]=0 : GROUP.ID[768]=3 : T[768]=-2.0622
...
GLOBAL.ID[1022]=1022 : LOCAL.ID[1022]=254 : GROUP.ID[1022]=3 : T[1022]=2.2044
GLOBAL.ID[1023]=1023 : LOCAL.ID[1023]=255 : GROUP.ID[1023]=3 : T[1023]=-0.6644
Let's give it a 768 value , does it like even group amounts ? (because of its cores number ?)
GLOBAL.ID[0]=0 : LOCAL.ID[0]=0 : GROUP.ID[0]=0 : T[0]=1.8908
...
GLOBAL.ID[255]=255 : LOCAL.ID[255]=255 : GROUP.ID[255]=0 : T[255]=0.0147
GLOBAL.ID[256]=256 : LOCAL.ID[256]=0 : GROUP.ID[256]=1 : T[256]=-1.5271
...
GLOBAL.ID[511]=511 : LOCAL.ID[511]=255 : GROUP.ID[511]=1 : T[511]=2.3339
GLOBAL.ID[512]=512 : LOCAL.ID[512]=0 : GROUP.ID[512]=2 : T[512]=-0.8512
...
GLOBAL.ID[767]=767 : LOCAL.ID[767]=255 : GROUP.ID[767]=2 : T[767]=-0.1783
Nope , no issues there 3 groups of 256 items each . Okay
Can we arrive at any conclusions here ? is the value :
int kernel_work_group_size=CLGetInfoInteger(ker,CL_KERNEL_WORK_GROUP_SIZE);
Informing us of the maximum work items a work group can have , because , that is what the gpu is doing on its own when it has no instructions ?
And if this is true , what about this value here ?
int device_max_work_group_size=CLGetInfoInteger(ctx,CL_DEVICE_MAX_WORK_GROUP_SIZE);
in fact let me add it in the code and see what it returns :
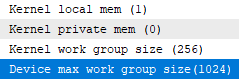
1024 it says . 1024 work groups or 1024 work items in work groups total ?
Well , let's find out .
If we were to get 1025 work groups (for this device) we'd need 1025*256 items , that's 262400 items .
Let's see . That's a big a** file ... but thankfully we only need the last row.
Well we get 1025 work groups ... okay
GLOBAL.ID[262399]=262399 : LOCAL.ID[262399]=255 : GROUP.ID[262399]=1024 : T[262399]=-0.1899
Are we approaching this wrong ? it does not have to mean 1025 work groups executed in parallel right ?
What if this indicates there can be 1024 work groups simultaneously working because this device has 1024 compute units ?
Even though it reports 1 compute unit (i'll add these info commands in too so you can compare) and even though the cuda toolkit reports 192 cuda cores and 32 warps .
This feels like :
- Nvidia half a**ed it
- OpenCL half a**ed it
- Mql5 half a**ed it
and we are left holding the grenade trying to figure out if its a bunch of grapes or not.
But we don't like half a**ing things we go full a** or no a**!
So , how can we tell what the f* is going on ?
We must measure time for execution , of what though ?
We need to discover the significant cutoff in execution time that indicates the cores are swapping groups , and , to complicate things , this must be versatile so if you run it you must receive an indication that when compared to my indications we can conclude or approach the activity in the device.
Not my device or your device but in general.(if possible)
Let's also note that if a manufacturer is not cooperating fully then there is no other outcome than 1/2*a**-ing it . So , mq and khronos are not to blame here , to be fair . So in that sense i must prepare to 0.5*a** it too. 😂
Okay , we now need to open a giant parenthesis and do something else unfortunately .
The current benchmark has a problem in that its using memory a lot .
If we want the "cutoff" of the cores to appear we must use more "calculations" than "fetching" .
This test also executes once we want it to execute constantly , there's our second issue if the cutoff is
close to our loop restarting we will not notice it!
Now you are thinking what i'm thinking : "why not resolve this at the lower levels , nvidia or amd" ? And the answer is probably "we did not spend all this R+D money for Khronos to come out and gain from it" , or , to simplify it "use Cuda , or , use Hpi" probably.
Less rant more code , or less typing more typing , besides , complaining makes you rich only if you are a lawyer or a politician ... 😂
Let's go for it even if it fails
Benchmark 2 : execution time cutoff with group size
Let's think , how can we measure the time it takes ?
MQ has provided a way to execute a kernel once i think . Let's confirm real quick .
Yeah , we can also send size 0 and play with the offset so we avoid the gpu cache .
Cool so , the benchmark will :
- load a calcs "heavy" kernel
- create a big test
- send the items one by one asynchronously ???....
hmmmmm theres another issue . We want to find the "bottleneck" of the GPU (or the device) but OpenCL will not let us do that as it will handle the load itself and we wont see anything so , how many kernels can we create ?
Can the benchmark be 1 thousand kernel handles their execution called at the same time (well in a loop) and then we'll start receiving
time it takes for a kernel to complete ? sounds reasonable . So to test open cl we will build an open cl . A tiny open cl 😂

So what will we need for the benchmark ?
- Kernels array
- Kernels start time
- Kernels end time
Then we'll output the times and decide how to proceed from there
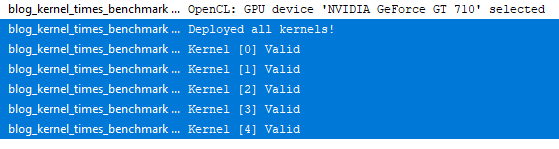
Okay let's write it and also do a first test running 5 kernels simultaneously and with different data!
Here is the first thing we code , can we run multiple instances of the same kernel ? ...
class kernel_info{
      public:
  int offset;//kernel offset in work
  int handle;//handle of kernel
ulong start_microSeconds;//kernel execution call time
ulong end_microSeconds;//kernel completed indication
      kernel_info(void){reset();}
     ~kernel_info(void){reset();}
 void reset(){
      offset=-1;
      handle=INVALID_HANDLE;
      start_microSeconds=0;
      end_microSeconds=0;
      }
 void setup(int _hndl,ulong _start,int _offset){
      handle=_hndl;
      start_microSeconds=_start;
      offset=_offset;
      }
 void stop(ulong _end){
      end_microSeconds=_end;
      }
};

kernel_info KERNELS[];

int OnInit()
  {
//---
  EventSetMillisecondTimer(33);
//---
   return(INIT_SUCCEEDED);
  }

void OnDeinit(const int reason)
  {
//---

  }
void OnTimer(){
  EventKillTimer();
  int ctx=CLContextCreate(CL_USE_GPU_DOUBLE_ONLY);
  if(ctx!=INVALID_HANDLE){
    string kernel="__kernel void bench(__global int* global_id,"
                                      "__global int* local_id,"
                                      "__global int* group_id,"
                                      "__global float* _tangent,"
                                      "int iterations){"
                                      "float sum=(float)0.0;"
                                      "float of=(float)_tangent[get_global_id(0)];"
                                      "for(int i=0;i<iterations;i++){"
                                      "sum+=((float)tanh(of-sum))/((float)iterations);"
                                      "}"
                                      "sum=(float)0.12345;"
                                      "_tangent[get_global_id(0)]=0.123;"
                                      "global_id[get_global_id(0)]=get_global_id(0);"
                                      "local_id[get_global_id(0)]=get_local_id(0);"
                                      "group_id[get_global_id(0)]=get_group_id(0);}";
    string errors="";
    int prg=CLProgramCreate(ctx,kernel,errors);
    if(prg!=INVALID_HANDLE){
    ResetLastError();
    //amount of kernels
      int kernels_to_deploy=5;
    //kernels to deploy will match the size of the "work"
      int iterations=1000;//iterations stays
      ArrayResize(KERNELS,kernels_to_deploy,0);
      bool deployed=true;
      for(int i=0;i<kernels_to_deploy;i++){
         KERNELS[i].handle=CLKernelCreate(prg,"bench");
         if(KERNELS[i].handle==INVALID_HANDLE){deployed=false;}
         }

      if(deployed){
      Print("Deployed all kernels!");
      for(int i=0;i<kernels_to_deploy;i++){
         if(KERNELS[i].handle!=INVALID_HANDLE){Print("Kernel ["+i+"] Valid");}
         else{Print("Kernel ["+i+"] InValid");}
         }
      }else{
      Print("Cannot deploy all kernels!");
      for(int i=0;i<kernels_to_deploy;i++){
         if(KERNELS[i].handle!=INVALID_HANDLE){Print("Kernel ["+i+"] Valid");}
         else{Print("Kernel ["+i+"] InValid");}
         }
      }
    //release
      for(int i=0;i<kernels_to_deploy;i++){
         if(KERNELS[i].handle!=INVALID_HANDLE){
           CLKernelFree(KERNELS[i].handle);
           }
         }
    CLProgramFree(prg);
    }else{Alert(errors);}
    CLContextFree(ctx);
    }
  else{
    Print("Cannot create ctx");
    }
  }
Well of course we can that's what this is for 😅
Although i'm detecting a bit of lag .
Let's jack this up to 50 kernels and measure time between on timer start and end . Without doing anything else just mounting 50 kernels on OpenCL.
We move the amount of kernels outside of the if blocks , slap 2 timers on start and end and print the difference :
  long timer_ended=GetTickCount();
  //load and unload total time ms
    long diff=timer_ended-timer_started;
    if(timer_ended<timer_started){diff=UINT_MAX-timer_started+timer_ended;}
    Print("Time to load and unload "+IntegerToString(kernels_to_deploy)+" kernels = "+IntegerToString(diff)+"ms");
    ExpertRemove();
and we run it again for 5 kernels :
2023.05.02 20:11:41.352 blog_kernel_times_benchmark (USDJPY,H1) Time to load and unload 5 kernels = 94ms
kay now do 50 kernels
2023.05.02 20:12:15.704 blog_kernel_times_benchmark (USDJPY,H1) Time to load and unload 50 kernels = 78ms
awesome , now do 50 kernels with a dead load (no cache)
2023.05.02 20:13:16.359 blog_kernel_times_benchmark (USDJPY,H1) Time to load and unload 50 kernels = 94ms
Excellent no delays there . Let's do bulk operations 5000 kernels . if we get 78ms we get the green light for the benchmark.
(there may be a print delay though :D so print what is not deployed only! and the status)
2023.05.02 20:15:35.724 blog_kernel_times_benchmark (USDJPY,H1) Deployed all kernels!
2023.05.02 20:15:35.746 blog_kernel_times_benchmark (USDJPY,H1) Time to load and unload 5000 kernels = 94ms
Great . lets go then !
We now need to turn calculations in the kernel to : get value , do insane amount of calcs on it , give value.
We have one condition that must be met for the iterations :
The milliseconds it takes to execute ONE work unit must be a certain magnitude bigger than the timer interval so that we can measure it !
So if the "benchmark" were to find the optimal iterations itself it would go into a loop until the iterations it sent are at "times" bigger than the interval.
Let me repeat what we are doing here : we want to "catch" the "shift" change in processing elements , meaning , the moment when the busy units unload and receive new data effectively , or so i think , giving us the number of processing elements (i'm guessing it will be equal to
CL_DEVICE_MAX_WORK_GROUP_SIZE What ?
Let me explain what i think can happen here :
We have a compute unit with 10 processing sub cores (the processing elements)
if i send 10 kernels at the same time for execution i will get 150milliseconds execution time overall , meaning , my minimum recorded time within the kernel info items subtracted from the maximum recorded time will be 150milliseconds.
Now if i run 11 kernels and i find ~300milliseconds that tells me something right vs if i found 170milliseconds .
Right ? i might be wrong .

Lets see ! this is fun ! 😍


")
![[XAUUSD]: Weekly Liquidity Activation Points (timings), June 22-26, 2026](https://c.mql5.com/6/1013/splash-preview-771790.png "[XAUUSD]: Weekly Liquidity Activation Points (timings), June 22-26, 2026")
")