Lorentzos Roussos / Profile
- Information
|
11+ years
experience
|
11
products
|
298
demo versions
|
|
220
jobs
|
0
signals
|
0
subscribers
|
💎 The simplest Neural Network Coding Guide : https://www.mql5.com/en/blogs/post/752324
💎 The simplest DLL for mql5 Coding Guide : https://www.mql5.com/en/blogs/post/753426
💎 Harmonic patterns scanner for MT5 : https://www.mql5.com/en/market/product/51212
💎 Similar price action candlestick patterns indicator for MT5 : https://www.mql5.com/en/market/product/133318
💎 Fibonacci Sonar indicator : https://www.mql5.com/en/market/product/133627
💎 Chart projection indicator : https://www.mql5.com/en/market/product/5569
💎 Youtube : https://www.youtube.com/@lorentzor1938
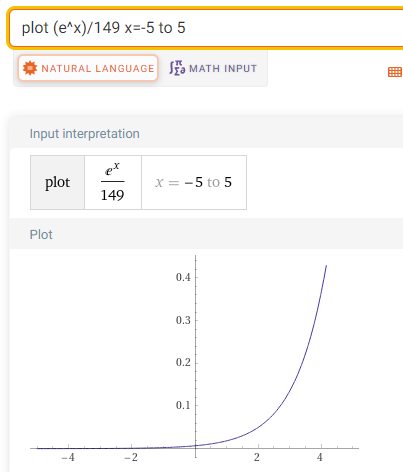
The derivative is the activation value , that will cover any extra calculations that keep the input range from -5 to 5
😍☕️ (ps:don't forget the normalization derivative)
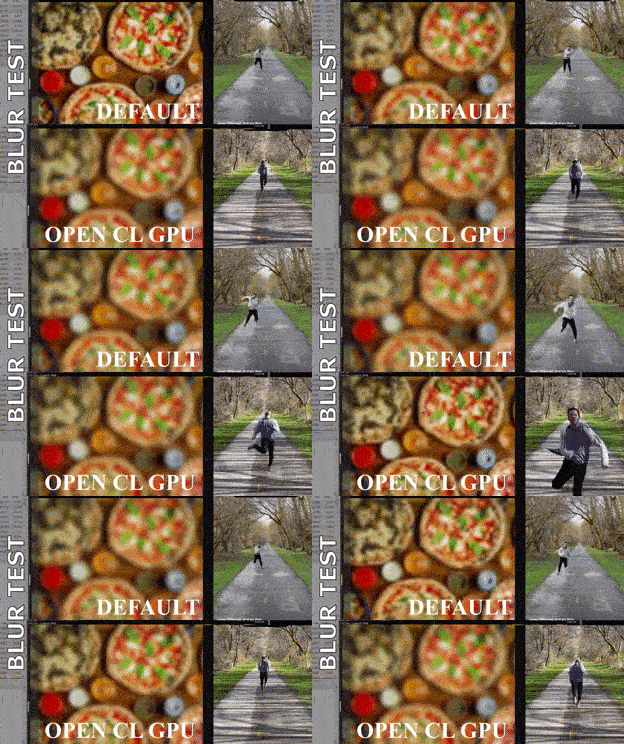
OpenCL 5x , and the algorithm is garbage still !
The top of the line GPU out there is 90x faster than the one that did this!
Source code here : https://c.mql5.com/3/407/imageBlurTest__1.mq5
Thread here :https://www.mql5.com/en/forum/446275
Thanks to William Roeder
[Wait for the Gif to load 😇]

Dive in : https://c.mql5.com/3/406/VectorActivationFunction.mqh
From here : https://www.mql5.com/en/forum/445076#comment_46333973
☕️


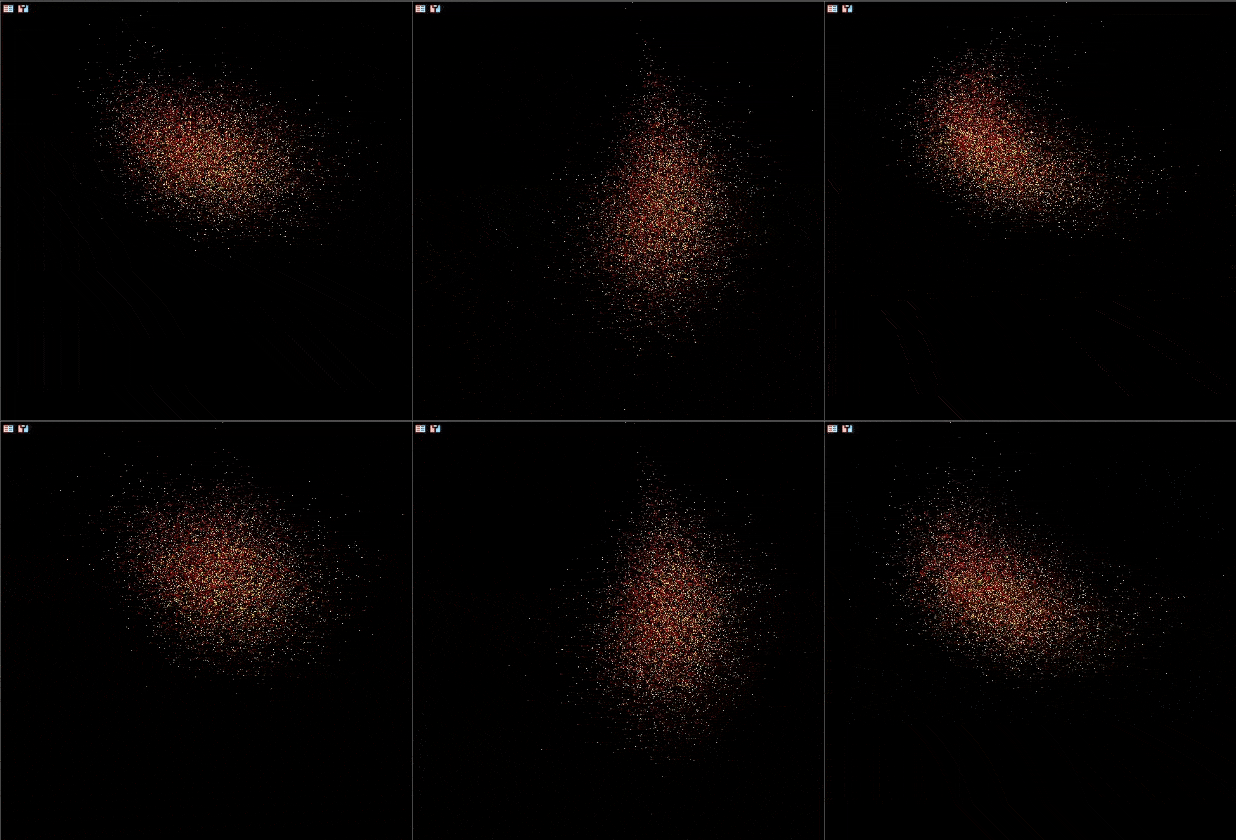
That means :
a.i'm terrible in math 😂
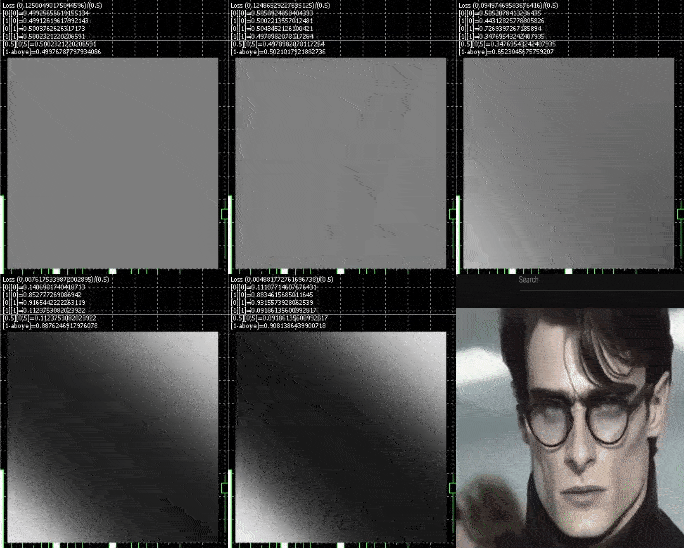
b.the network believes "if you slap it around it will work" 😂(on a serious note , the display is the "world" the network creates )
back to the drawing board...
(90 features one node)

✔️ Support Resistance Levels
✔️ Projection
✔️ Currency Strength of the 2 chart currencies (if on a currency pair)
✔️ Renko Chart
✔️ Heiken Ashi Chart
✔️ Some Data Charts
✔️ Info on latest asset highs and lows (such as 2nd higher high etc)
💎 More Info on this short video (dont need to have sound on its quitte visual) : https://www.youtube.com/watch?v=qkwq43ic2cs
📢 Subscribe to Telegram Channel for more : https://t.me/lorentzor
Chart Projection Indicator Chart projection started as a small indicator that used the built in zig zag technical indicator to forecast future price action (you can find the old algorithm in the comments) The idea is simple , past price action does not translate into the future but maybe if we don't get overly specific ,or , overly generic ,we can extract guidelines about what could happen . The "thesis" of Chart projection is this : Traders will look at the chart to make their decisions , so
Volume Profile Indicator / Market Profile Indicator What this is not : FMP is not the classic letter-coded TPO display , does not display the overall chart data profile calculation , and , it does not segment the chart into periods and calculate them. What it does : Most importantly ,the FMP indicator will process data that resides between the left edge of the user defined spectrum and the right edge of the user defined spectrum. User can define the spectrum by just pulling each end of the
Harmonic patterns scanner and trader . Some Chart patterns too if you would rather see this on a live chart instead of reading the description , you can instantly download a free demo here. Patterns included : ABCD pattern Gartley pattern Bat pattern Cypher pattern 3Drives pattern Black Swan pattern White Swan pattern Quasimodo pattern or Over Under pattern Alt Bat pattern Butterfly pattern Deep Crab pattern Crab pattern Shark pattern FiveO pattern Head And Shoulders pattern
Harmonic patterns scanner and trader . Some Chart patterns too Patterns included : ABCD pattern Gartley pattern Bat pattern Cypher pattern 3Drives pattern Black Swan pattern White Swan pattern Quasimodo pattern or Over Under pattern Alt Bat pattern Butterfly pattern Deep Crab pattern Crab pattern Shark pattern FiveO pattern Head And Shoulders pattern Ascending Triangle pattern One Two Three pattern And 8 custom patterns Voenix is a multi timeframe and multi pair harmonic
Chart Projection Indicator Chart projection started as a small indicator that used the built in zig zag technical indicator to forecast future price action (you can find the old algorithm in the comments) The idea is simple , past price action does not translate into the future but maybe if we don't get overly specific ,or , overly generic ,we can extract guidelines about what could happen . The "thesis" of Chart projection is this : Traders will look at the chart to make their decisions , so
