Soft Indicator
- Indicators
- Version: 1.20
- Activations: 5

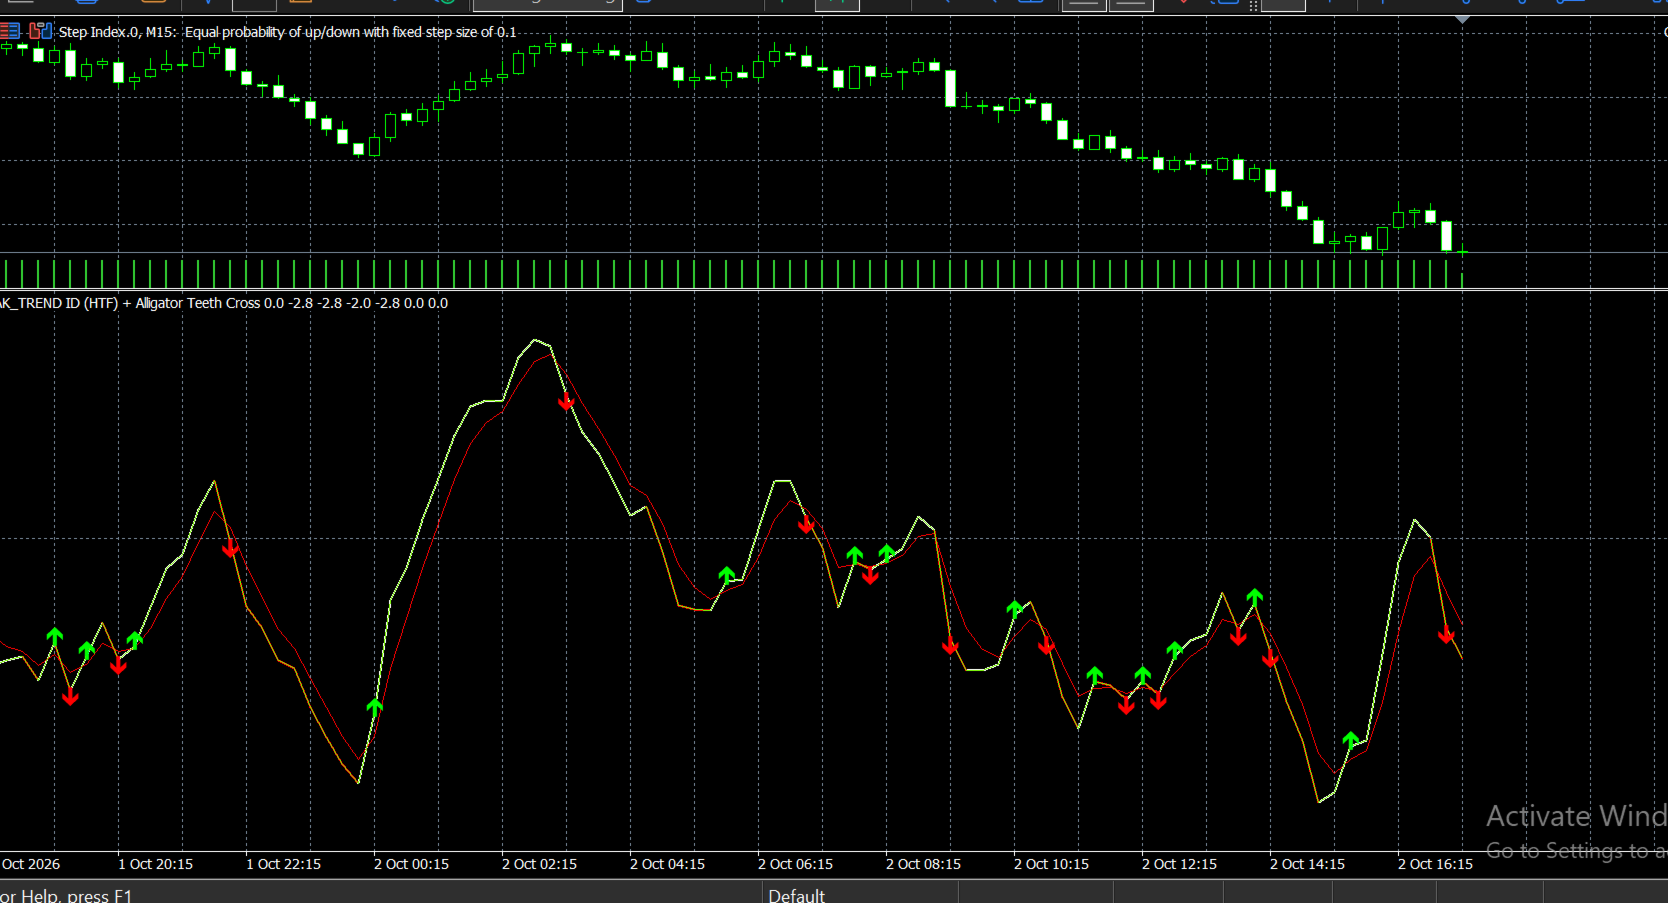
AK_TREND_ID_HTF Two-Timeframe Trend Radar with Instant Cross Signals
Most trend tools show you one timeframe and leave you guessing about the bigger picture. AK_TREND_ID_HTF reads the trend on your chart AND a higher timeframe at the same time — and paints the line so you instantly see when both agree. One glance, full picture.
🎨 One Line, Five Colors — Read the Market at a Glance
- 🟢 GREEN — both timeframes bullish and rising: strongest momentum
- 🔵 BLUE — both bullish but cooling: trend losing steam
- 🔴 RED — both bearish and falling: strongest downtrend
- 🩷 PINK — both bearish but turning up: bounce attempt
- ⚪ WHITE — timeframes disagree: stand aside, expect chop
The line itself is the spread between a fast and a slow EMA — above zero the bulls control, below zero the bears do. No interpreting candles, no switching charts.
🐊 A Full Alligator Built Into the Oscillator Jaws, Teeth and Lips — computed directly on the trend line itself, exactly like MT5's "Apply to: First Indicator's Data". The Teeth line is your momentum trigger: trend line above it = long bias, below it = short bias. Zero extra indicators, zero chart clutter.
⚡ Instant Arrows — Live Signals, Not Late Ones A BUY arrow prints the moment the trend line crosses above Teeth; a SELL arrow the moment it crosses below. Signals are evaluated on every tick, so they appear on the live candle — the earliest possible warning. Prefer confirmed signals? Simply act on closed candles.
🧭 Use It Your Way
- Trend filter for manual trading — take trades only when the line isn't white
- Cross signals with the Alligator Teeth for entries
- Confluence check for any EA or strategy
- Works on forex, indices, metals, synthetics — any symbol, any chart timeframe
- Choose any higher timeframe (default: Monthly) to match your style
⚙️ Fully Adjustable Fast/slow EMA lengths, higher timeframe, and Alligator periods + shifts for all three lines — every parameter is an input.
The honest edge: this isn't a hidden-formula "magic" indicator — it's a clean dual-timeframe EMA-spread engine with transparent, logical color states you can verify on any chart. Simple math, clearly presented, instantly readable.
⏱ Recommended usage: works on all timeframes; best readability from 15M upward. Pair it with a higher timeframe 4–20x your chart timeframe (e.g. H1 chart + D1 filter)