INS Ghost Lines
- Indicators
-
Jeffrey John Reduca Rama
 I am an MQL5 developer specializing in creating Expert Advisors, indicators, and trading utilities for the MetaTrader 5 platform.
My focus is on delivering clean, reliable code with practical use in real trading environments. - Version: 3.0
- Activations: 20
Features of the Multi-Timeframe Line Overlay Indicator
-
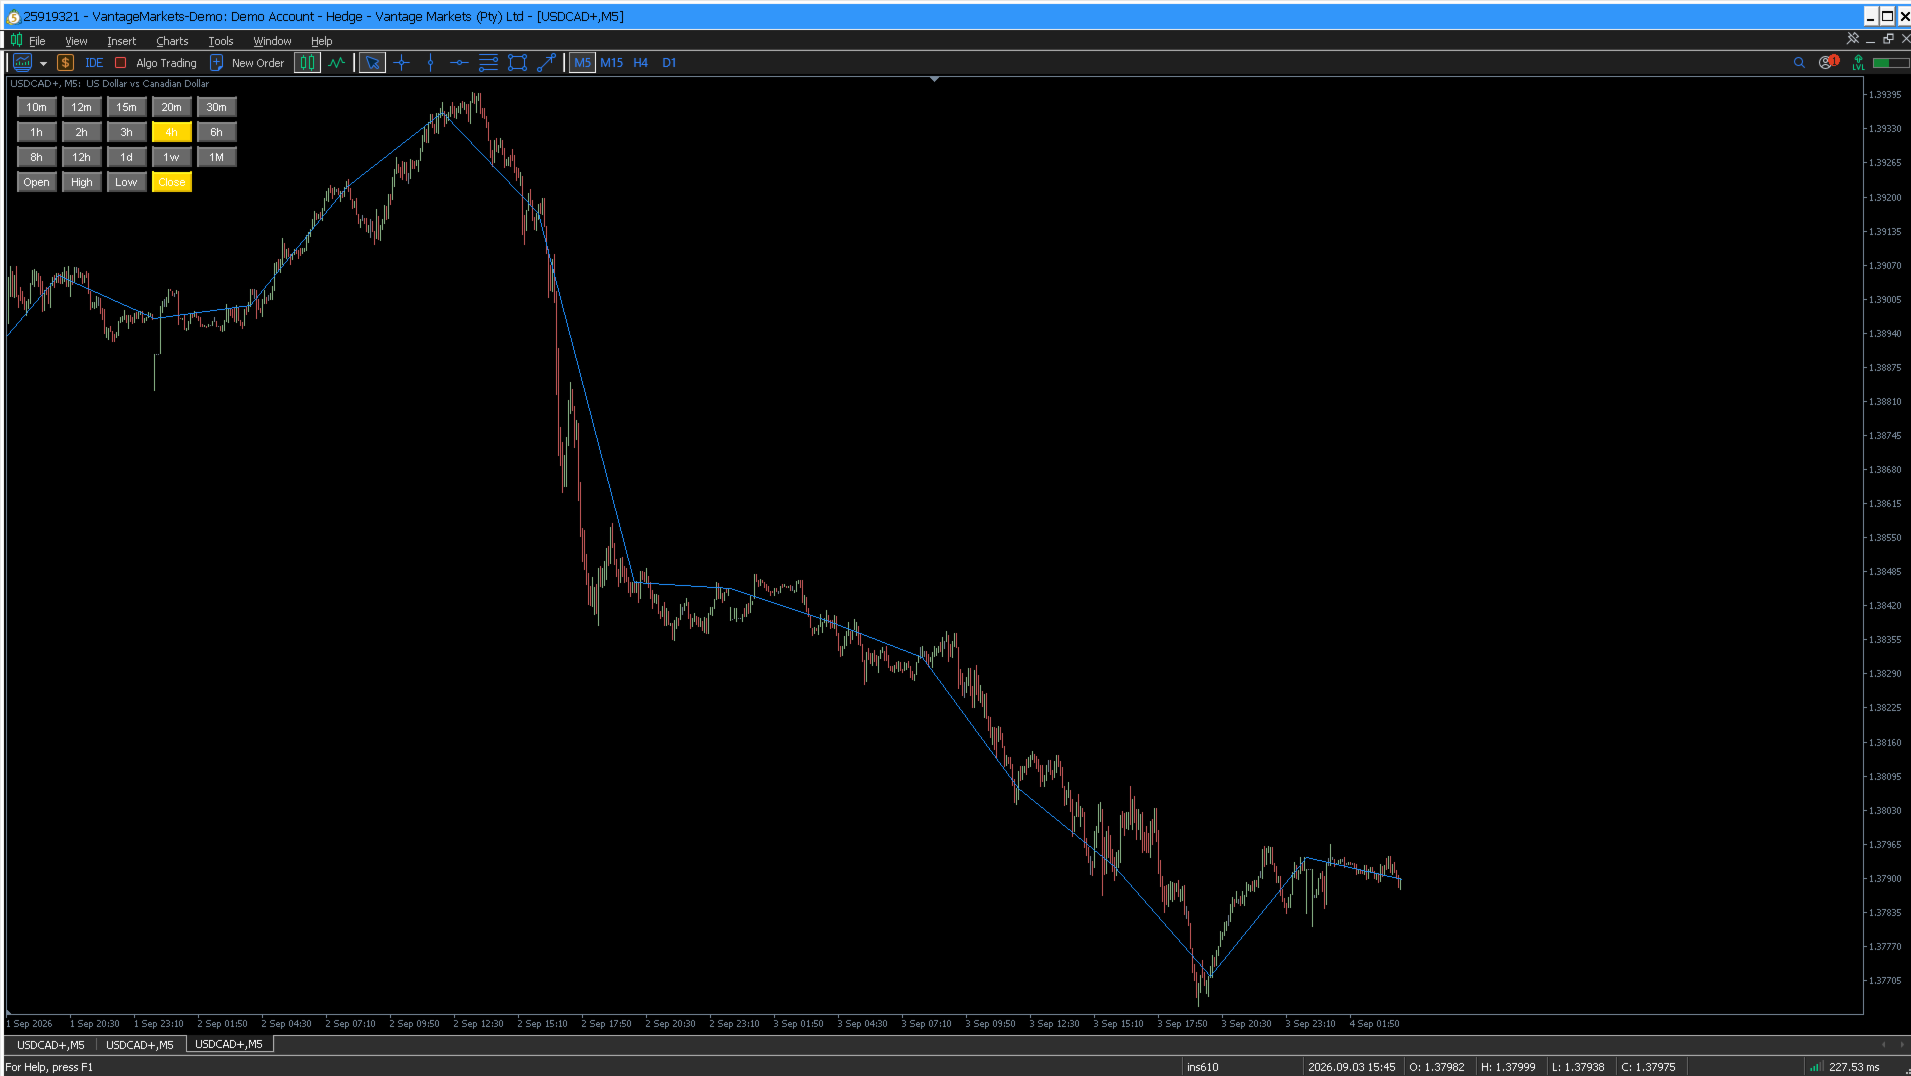
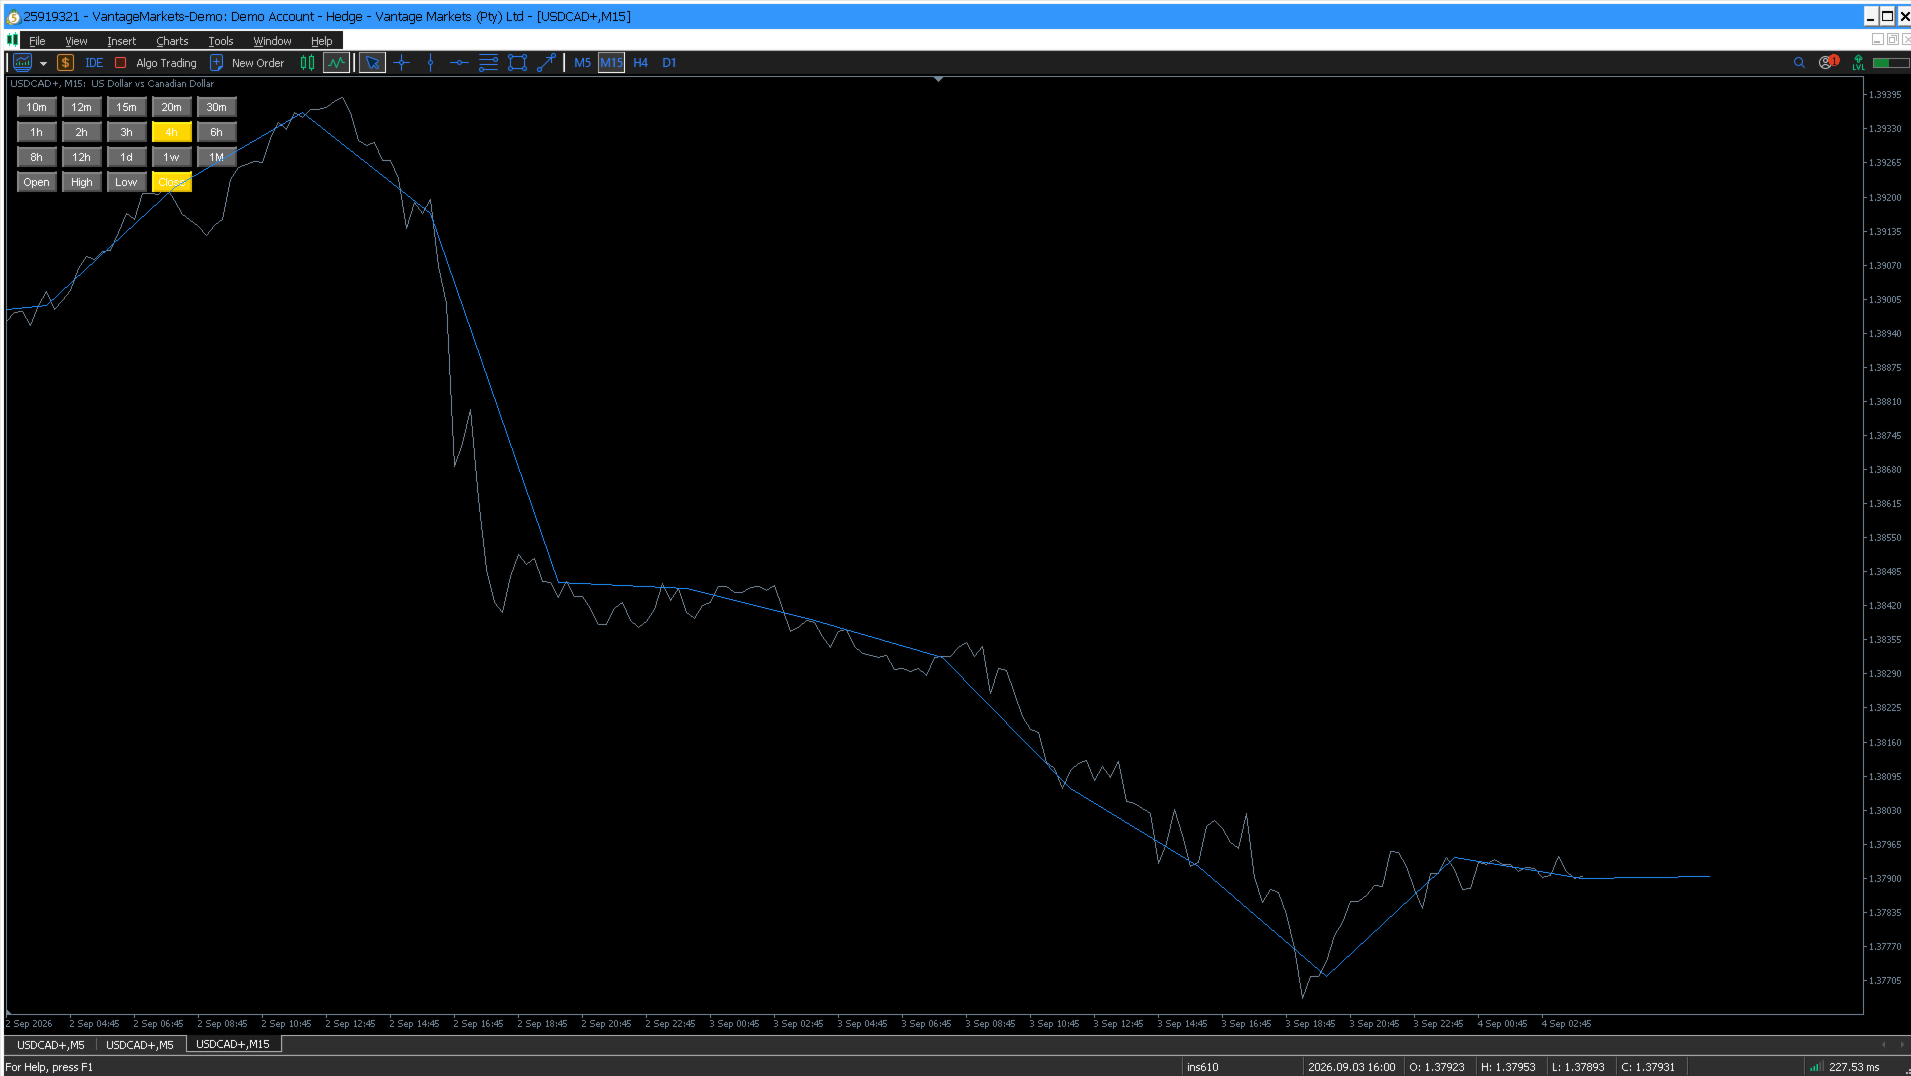
Multi-Timeframe Price Line Overlay
Draws a continuous line on the current chart representing the selected price type (Open, High, Low, Close) from a chosen higher/lower timeframe, without switching charts. -
Interactive On-Chart Buttons
-
Timeframe Grid (3×5): 15 predefined timeframes (M10 to MN1) as clickable buttons.
-
Price Type Row: Open, High, Low, Close buttons to select which price is plotted.
-
Active button is highlighted in gold for clear visibility.
-
-
Customizable Appearance
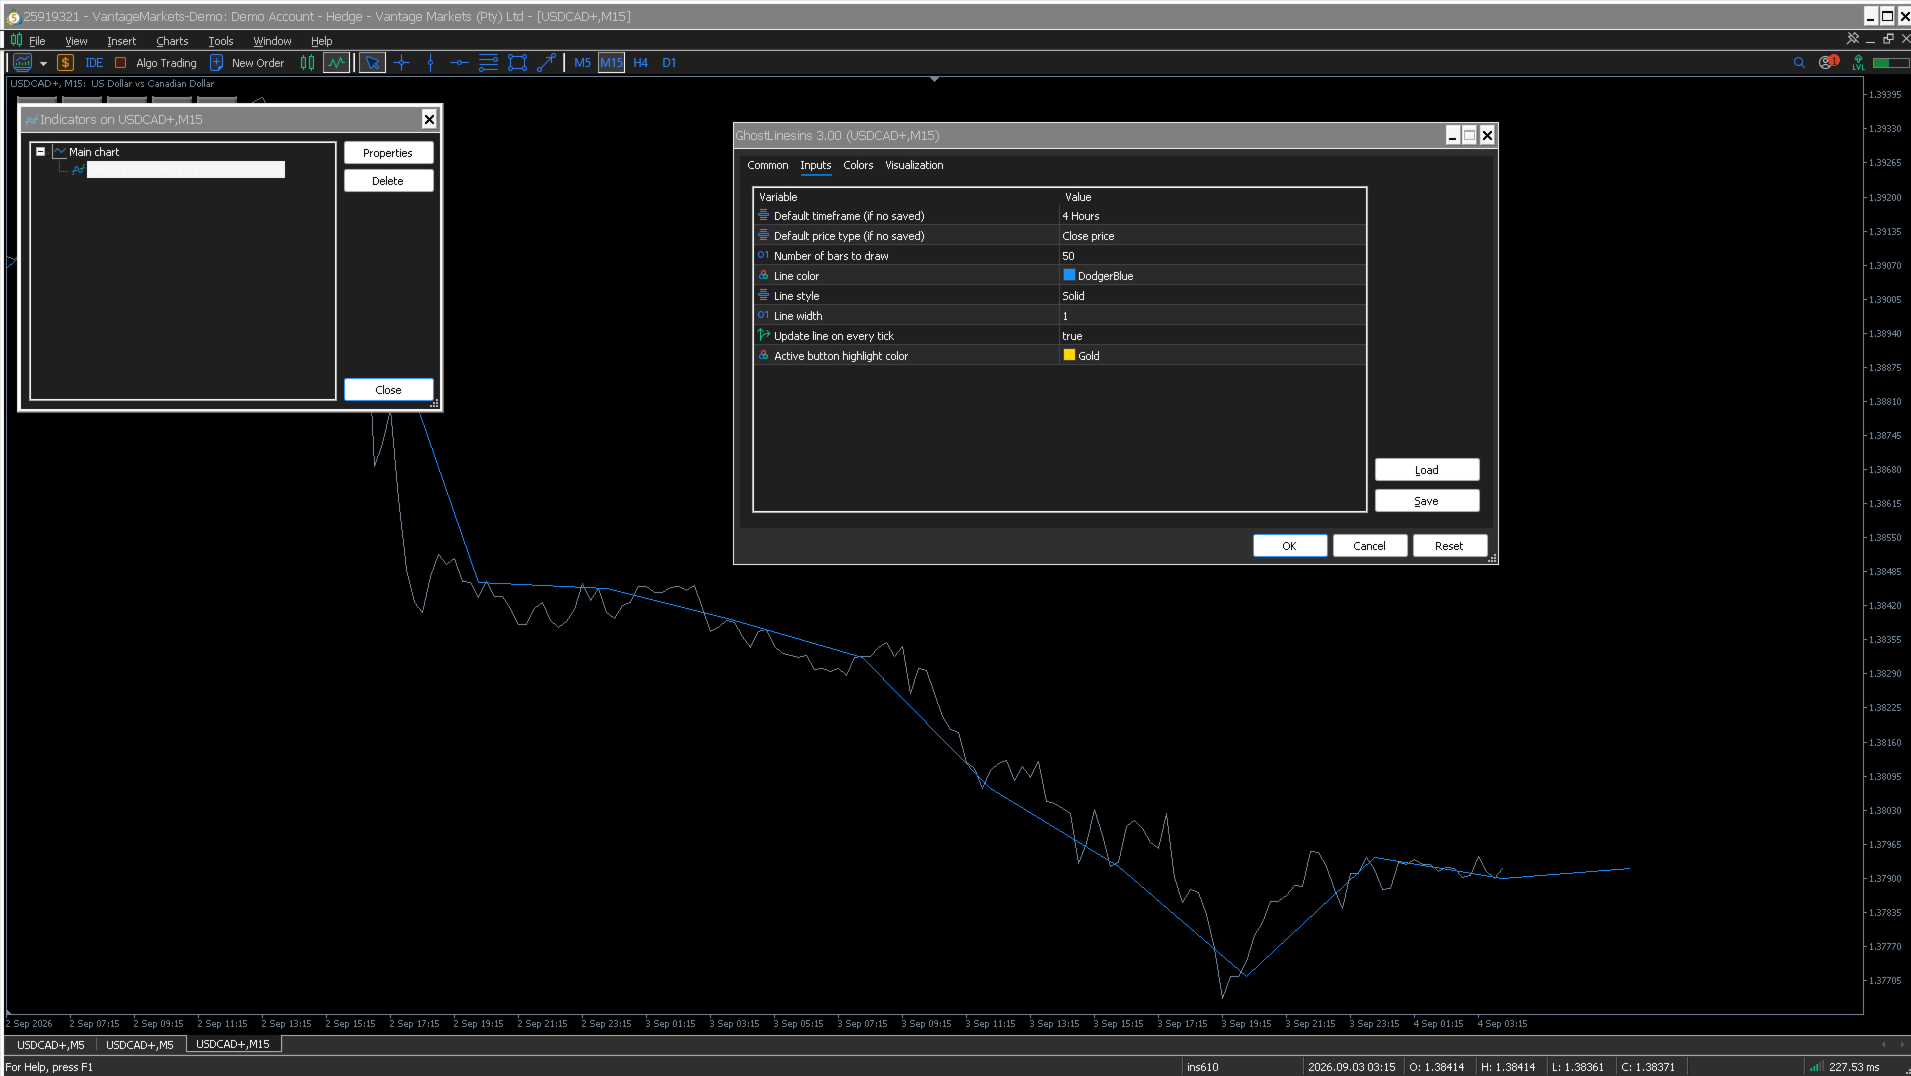
Adjustable line color, style (solid, dashed, etc.), width, and number of bars to draw. -
Session Persistence
User selections are stored in temporary global variables, so they are remembered when the indicator is reattached or the chart is changed within the same MT5 terminal session. -
Real-Time Update Option
UpdateOnTick input allows the line to refresh on every tick or only when a new bar forms on the selected timeframe. -
Non‑Intrusive Objects
All drawn objects (buttons and lines) are hidden and non‑selectable, keeping the chart clean while remaining fully functional. -
Compact and Efficient
Uses no indicator buffers/plots—only graphical objects, minimising resource usage.
Advantages for Traders
-
Enhanced Multi‑Timeframe Analysis
Quickly overlay a higher timeframe trend (e.g., H4 close prices) onto a lower timeframe chart (e.g., M15) to align entries with the larger trend. -
Instant Parameter Switching
Change timeframe or price type with a single click, eliminating the need to open the indicator settings dialog—ideal for fast‑paced trading environments. -
Flexible Analytical Views
Choose Open/High/Low/Close lines to:-
Track support/resistance from previous highs/lows on a higher timeframe.
-
Visualise the exact path of closing prices for trend confirmation.
-
Compare different price types without switching charts.
-
-
Workflow Efficiency
Temporary global variables ensure your preferred settings persist during the session, so you don’t need to reconfigure after changing charts or reattaching the indicator. -
Visual Clarity
The active button highlight and customisable line appearance make the overlay easy to distinguish from other chart elements. -
Real‑Time Adaptability
With UpdateOnTick = true , the line updates instantly as price changes, making it suitable for live monitoring of dynamic levels. -
Broad Timeframe Coverage
Includes uncommon timeframes like M12, M20, H2, H3, H6, H8, H12, giving traders precise control over the intermediate levels often used in strategies like ICT or swing trading.