Elektra Look Left
- Indicators
- Version: 1.10
- Activations: 10

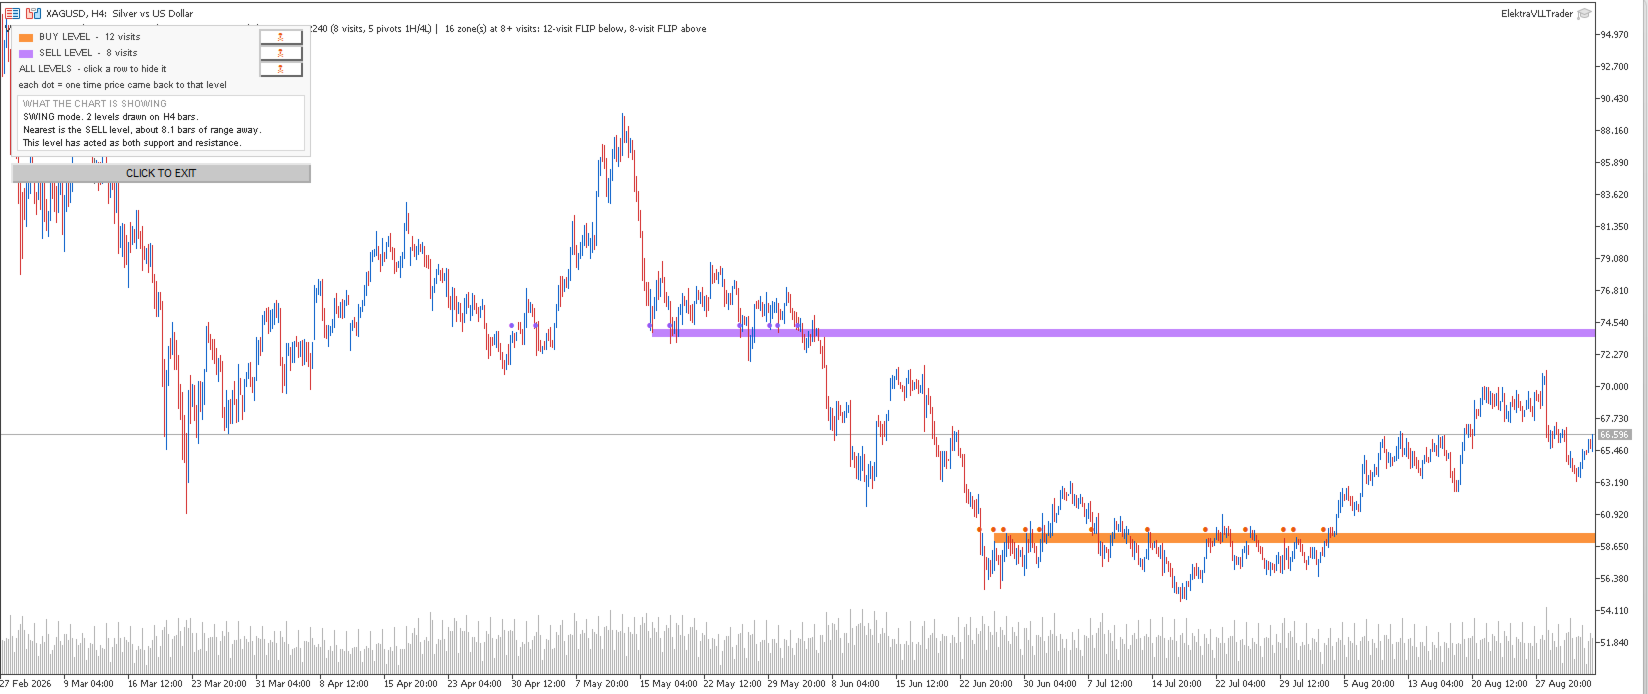
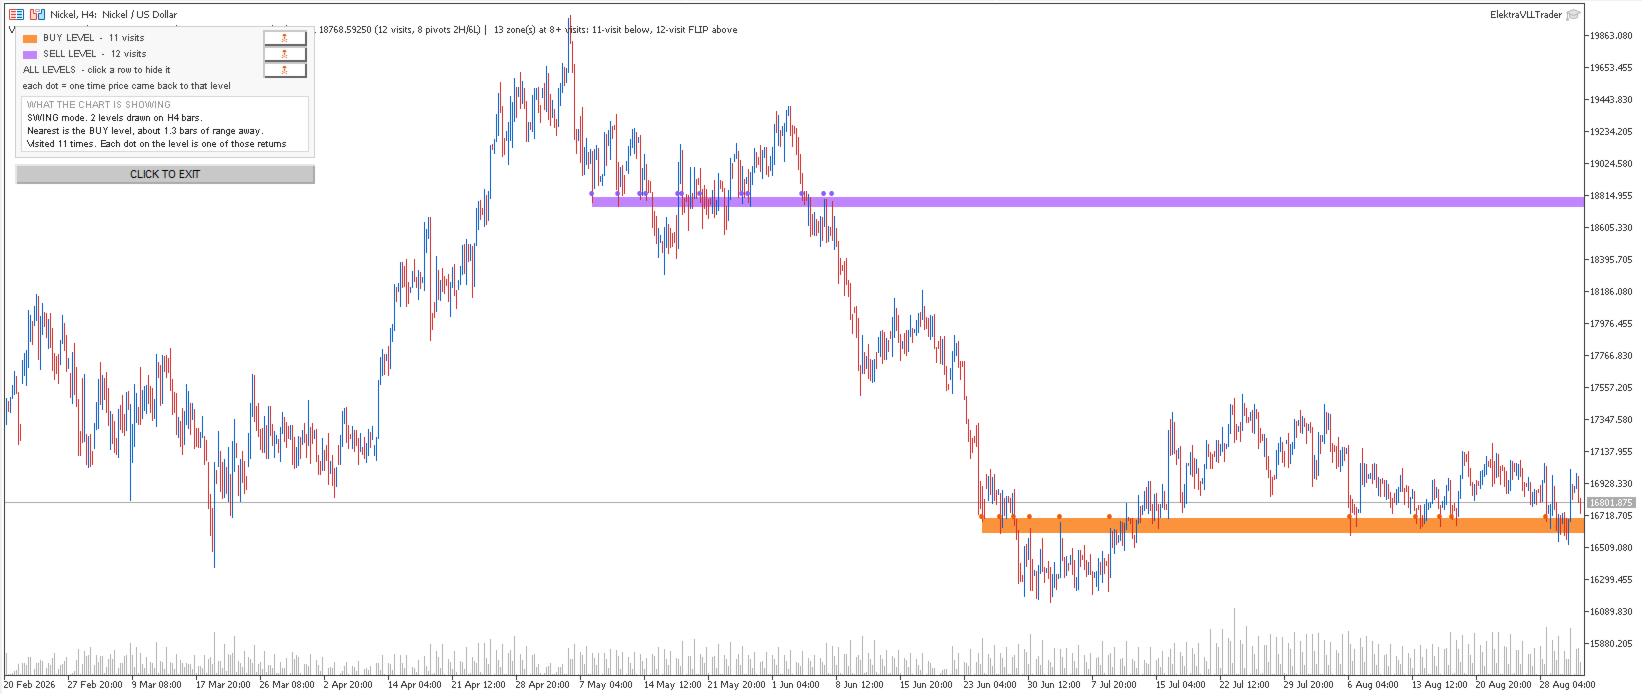
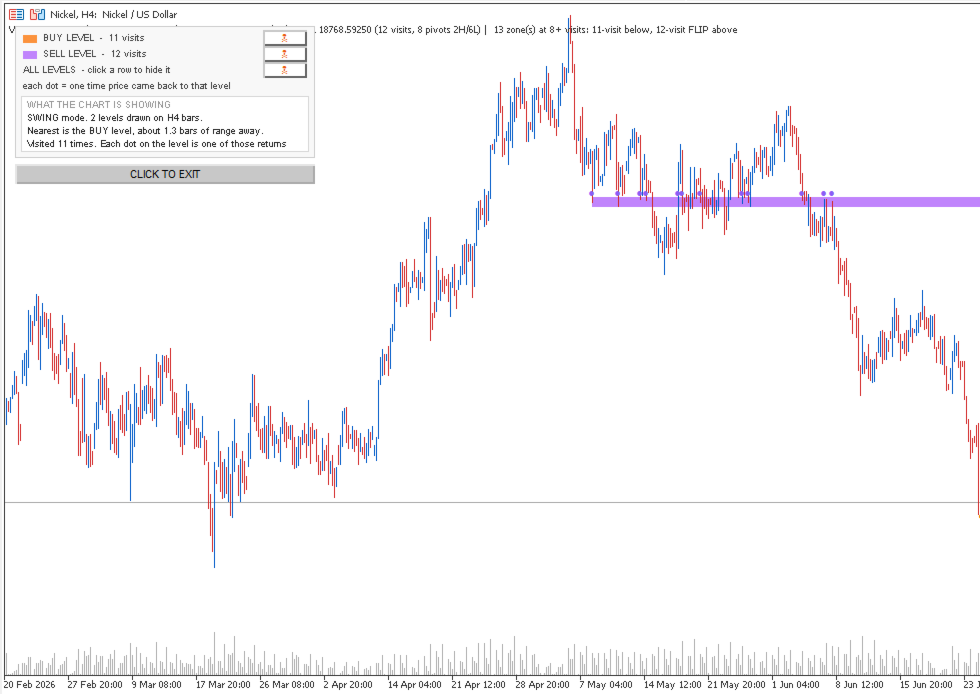
An indicator that marks support and resistance areas by counting how many separate times price has returned to them. Every counted return is marked on the chart, so the count can be checked against the chart history.
What it draws
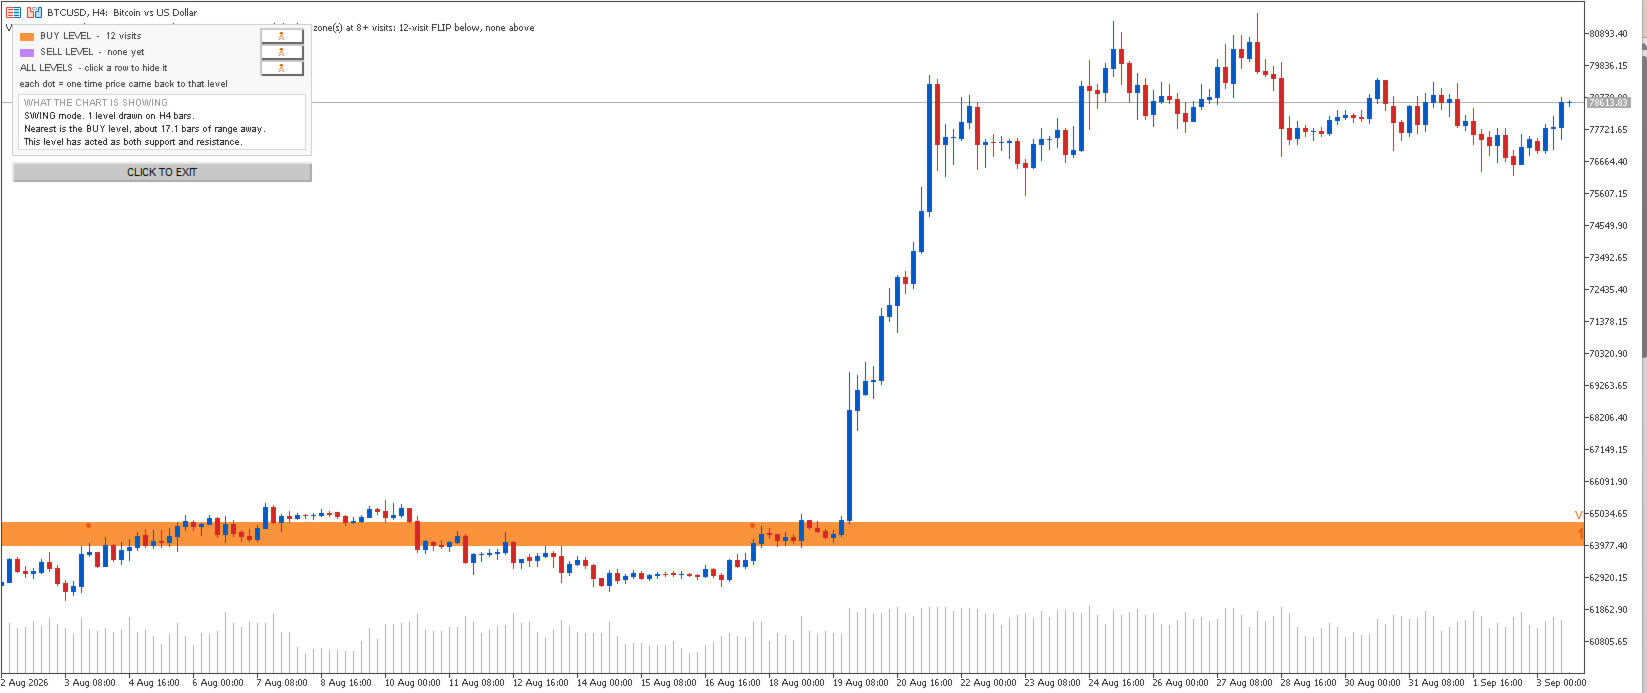
Elektra Look Left draws two zones. One below price, for buys. One above price, for
sells. Nothing else is added to the chart.
Each zone is drawn as a rectangle rather than a single line. The height of the
rectangle is the measured spread of the swings that formed the level, so the
area the level occupies is visible on the chart.
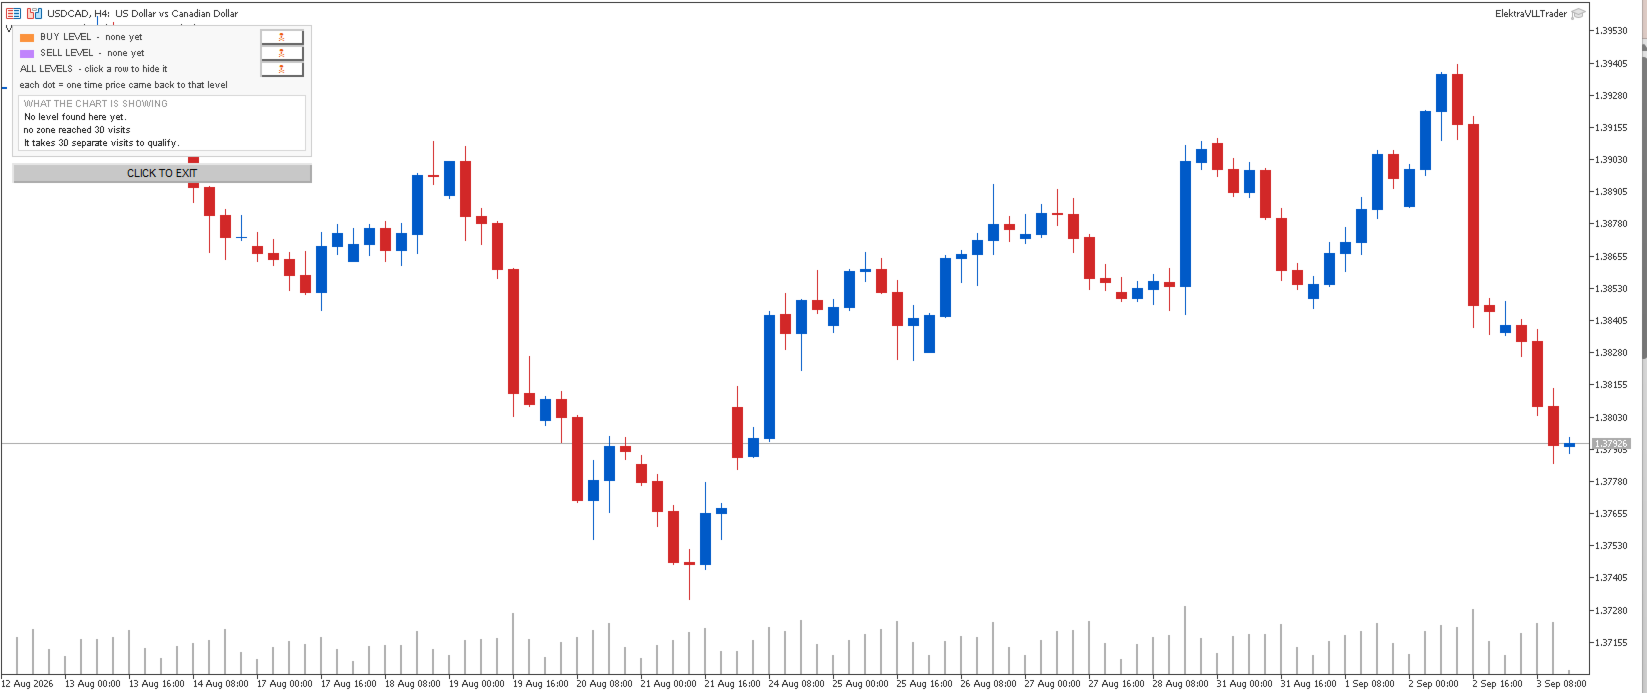
If no level on a side meets the qualifying conditions, that side is left empty.
If neither side qualifies, the indicator draws nothing and states this on the
chart.
How a level is selected
The indicator examines the price history to the left of the current bar and
counts visits to each price area. A visit is recorded when price leaves an area
by a set distance and later returns to it. A period of consolidation inside an
area is counted as one visit rather than as many.
The number of visits required to qualify is set by the Minimum visits input.
The default is eight. This value can be changed.