 MetaTrader 5
 Experts
 Indicadores
 Bibliotecas
 Utilitários
 Widgets
 Regras
Conheça o Mercado MQL5 no YouTube, assista aos vídeos tutoriais
Como comprar um robô de negociação ou indicador?
Execute seu EA na
hospedagem virtual
hospedagem virtual
Teste indicadores/robôs de negociação antes de comprá-los
Quer ganhar dinheiro no Mercado?
Como apresentar um produto para o consumidor final?
Indicadores Técnicos para MetaTrader 4 - 149
 É com base nos sinais de indicadores técnicos listados abaixo que você pode aplicar as decisões para abertura ou fechamento de uma transação na plataforma MetaTrader 4.
O funcionamento dos indicadores reside na previsão de mudanças de preço, com base na conversão matemática de preço e/ou volumes de um instrumento financeiro.

Tired of being on the wrong side of the trend? MT4 ROADS puts the power of the Moving Average Channel in your hands. Dynamically plots buy and sell zones using a custom moving average Clearly identifies the current market trend for more confident trading Fully customizable settings to optimize performance for your strategy Visual signal potential trend changes before they happen The MT4 ROADS indicator is your personal market navigator, guiding you through the unpredictable ebb and flow of volat
推荐这款分时均线指标程序!它在主窗口直观展示实时价格与 30 分钟、60 分钟、120 分钟均线,助您精准把握日内趋势。参数可灵活调整,支持多种均线类型,适配不同交易风格。代码优化高效,避免重复计算,运行流畅。清晰的多色线条与标签设计,让价格与均线的关系一目了然,助力您快速捕捉交易信号。简洁实用的设计,是日内交易者分析行情的得力工具,值得一试。配合MACD及HAM买卖提示能对交易有质的提升。 1. 指标显示设置 借助 #property 指令对指标的显示属性加以设置: #property indicator_chart_window :保证指标在交易图表的主窗口显示。 #property indicator_buffers 4 :设定指标运用 4 个数据缓冲区,分别用来存储实时价格以及 3 种不同周期的均线数据。 #property indicator_colorX :为不同的线条设定颜色,例如价格线是蓝色,30 分钟均线是红色,60 分钟均线是绿色,120 分钟均线是紫色。 2. 输入参数设置 提供了几个可调节的输入参数,用户能够依据自身需求进行修改: MAPeriod1 、

Receive notifications for multi-trendline or single trendline breakout. Yes! You heard us right! You will be notified the moment price crosses any and all the timeframe trendlines that you have chosen. 1. ADDING MULTIPLE OR SINGLE TRENDLINES IN THE SAME DIRECTION To trigger a stronger trading opportunity you can require that price breaks one or more trend lines of different timeframes in the same direction. To do this navigate to the timeframe for which you want to add a trendline and click
Advantages of EMA Moving Average Trading System:
Trend-Following Nature : EMAs effectively identify and follow market trends by giving more weight to recent prices, allowing traders to stay aligned with the dominant market direction. Reduced Lag : Compared to Simple Moving Averages (SMAs), EMAs react more quickly to price changes, making them better suited for dynamic market conditions. Flexibility : Traders can customize EMA periods to match different trading styles (e.g., short-term, medium-
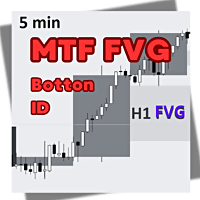
Brevemente sobre FVG mtf btn:
O indicador " FVG mtf btn " é uma ferramenta de análise técnica que identifica e exibe as lacunas de justo valor ( FVG ) no gráfico. O FVG é uma área de desequilíbrio de preços onde o mercado se moveu rapidamente, deixando um fosso entre níveis de preços que não foram totalmente testados pelo mercado. Estas lacunas geralmente atuam como áreas de interesse para os traders, uma vez que o preço tende a regressar a essas áreas para as "preencher" antes de continuar a
Reversal Pattern AI is a groundbreaking advancement in indicator development, combining artificial intelligence algorithms, multi-level market analysis, and classical technical analysis methods. It not only detects reversal patterns but also evaluates market inefficiencies, generating highly accurate trading signals.Thanks to its hybrid model, which utilizes price action analysis, volume, volatility, VWAP, and Volume AVG %, the indicator easily adapts to any market conditions. Reversal Pattern A
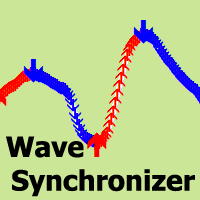
O Wave Synchronizer é um indicador visual de análise de ondas. Combina sequências de movimentos de velas e cria ondas direcionais, produzindo movimentos sincronizados juntamente com o mercado.
O início de cada onda começa com uma seta de sinalização, existindo também alertas.
O indicador nunca redesenhará ou moverá as setas no histórico anterior.
Aparecem setas de sinal no fecho da vela.
Adapta-se para trabalhar com quaisquer instrumentos de negociação e prazos.
Fácil de utilizar e configurar,

Direct Scalping MT4 shows the most SUPER SUPER SUPER EARLY opportunity to scalp the market. Do entry as early as possible, as soon as the first sign appears. It plays sound alert so that you can wait the moment while do something else. Remember to cut loss below the '' area. Yes, it is not stop loss but cut loss (exit on candle close).
Made for M1 timeframe, but higher is good too.
My new favorite setup: M3 using 8 indicators with different parameters: 11, 18, 25, 32, 39, 46, 53, and 60. Comb

Pro Period Separators For MetaTrader 4 The built-in period separators feature doesn’t allow users to specify the time period, so you can use this indicator to create advanced period separators, you can add daily, weekly, monthly, yearly separators on any time frame. Default Inputs DAILY SEPARATOR SETTINGS show daily separators = Yes hour of the separators = 04 minute of the separators = 00 color of the separators = Silver width of the separators = 1 style of the separators = STYLE_DOT WEEKLY_SE

O ICT Asian Range Indicator é uma ferramenta poderosa projetada para ajudar os traders a identificar as principais estruturas de mercado e zonas de liquidez com base na ICT Asian Range Trading Strategy. Ele marca os níveis de preço mais altos e mais baixos da sessão asiática (das 19h à meia-noite, horário de Nova York) e fornece insights críticos sobre os movimentos do mercado para as sessões de negociação seguintes. Este indicador aprimora a precisão da negociação destacando varreduras de

"PACIFIC BREAKOUT" — Catch a Wave of Profit on Breakouts of Sessions! Are You Tired Of Missing Key Breakouts?
Manual calculation of levels, dozens of indicators and missed signals will be a thing of the past! What Does Pacific Breakout Do? This is your personal analytical robot that: The pulse accumulation range of the Pacific session is automatically determined (1:00 GMT+3 Sydney). - We analyze the second candle after the market opens, because the extended spread does not giv

O High Low Tracker é um indicador essencial para qualquer trader que valoriza precisão e clareza na identificação de níveis-chave de preços. Projetado para traders que usam estratégias institucionais como ICT (Inner Circle Trader) , BTMM (Bank Trading Market Maker) e SMC (Smart Money Concepts) , esta ferramenta simplifica a análise de vários períodos de tempo ao traçar máximas e mínimas significativas diretamente no seu gráfico atual. Quer você esteja fazendo scalping, day tr
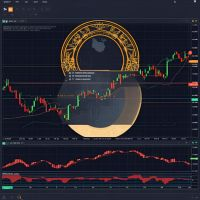
Moving MinMax is a custom trend indicator that helps you easily identify the current market direction , reversals , and high-probability trade setups . This tool uses a unique calculation method that measures price pressure from both buyers and sellers, helping you see who is in control and when the market is likely to change direction. Unlike basic oscillators or moving averages, this indicator computes trend likelihoods using a distribution-based exponential model applied over a moving price w

How to Use this indicator-: 1. Trend-Following Strategy Objective : Enter trades in the direction of the trend when the Net Score and Signal Line confirm a strong trend. Identify the Trend : Look at the Net Score in the separate window: If the Net Score is above 0 and rising, the trend is bullish. If the Net Score is below 0 and falling, the trend is bearish. Confirm with the LazyLine on the main chart: Green LazyLine indicates an uptrend. Red LazyLine indicates a downtrend. Entry : Buy (Long)

Overview:
"TrendLine Alerts" is a dynamic, multi-functional trading tool designed to monitor and alert traders in real-time when price action touches or breaks critical technical levels. Built for precision, it seamlessly tracks trendlines, horizontal support/resistance, vertical time-based lines, and equidistant channels , ensuring you never miss a key market movement. Whether you’re scalping, swing trading, or managing long-term positions, this indicator acts as your 24/7 market sentinel. K

QQE Divergen – Advanced Trading Indicator
Overview
The QQE (Quantitative Qualitative Estimation) indicator is a powerful trading tool designed to enhance trend detection and market momentum analysis. QQE is an advanced version of the RSI (Relative Strength Index) that utilizes smoothed moving averages and dynamic trailing levels to generate highly accurate signals.
QQE Divergen improves upon the traditional QQE by integrating divergence detection, making it even more effective for identi
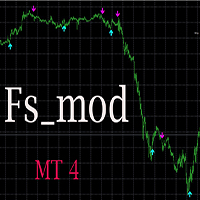
Fs_mod стрелочный индикатор, указатель направления тренда. Индикатор НЕ перерисовывает и не изменяет свои показания, стрелки появляются по закрытию бара и остаются на своих местах. При появлении стрелки дает несколько типов оповещений. Индикатор предназначен для использования на следующих финансовых инструментах: - Forex - индексы - акции. Рекомендуется использовать на таймфреймах не ниже 15 мин

Multi Stochastic Display – The Ultimate MTF Trade Scanner for Forex & Crypto Multi Stochastic Display is a powerful multi-timeframe trading tool that gives you a professional edge in analyzing market momentum. Designed for both Forex and Crypto traders, this clean and modern indicator visually presents BUY and SELL signals across 9 timeframes (from M1 to Monthly) for over 25 instruments. Its intuitive panel automatically ranks all instruments based on their strongest stochastic trend – whethe

O indicador de Candles de Múltiplos Períodos é uma poderosa ferramenta de visualização projetada para ajudar os traders a alinhar suas análises de períodos menores com a estrutura de períodos maiores. Ao plotar candles de um período maior selecionado (H1, H4, D1, etc.) diretamente no seu gráfico atual, este indicador oferece uma perspectiva mais clara da narrativa geral do mercado sem precisar alternar entre os gráficos.
Quem precisa deste indicador? Esta ferramenta é ideal para: Conceito
Supply demand zone with added Alerting system. Why this supply demand indicator is different? Zones are not traditional zones. these are KIRI zones. these are high probability zones where market reacts no matter how much. Most people including me have been missed out of trade because we somehow got distracted. no worries, i have added an alert to our zones now. (Metatrader doesn't show alerts in strategy tester) Most people dont know when to enter the market when it comes to zone based trading.

PinBar Hunter – Smart Pin Bar Indicator with Built-in Control Panel and Signal Filters PinBar Hunter is a powerful tool for technical traders that automatically detects classic Pin Bar patterns (reversal candles) on the chart.
It’s designed for price action strategies, candlestick analysis, and trading around key support/resistance levels. Indicator Features: Detects classic Pin Bars (reversal candlestick patterns)
Works on any timeframe and instrument
Suitable for trend-following an
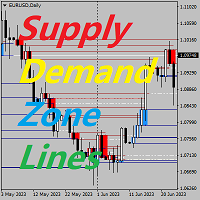
Indicadores-chave de preços da zona de oferta e demanda fundo O sistema busca automaticamente áreas de oferta e demanda na linha K e desenha linhas de preços-chave em tempo real. Os comerciantes podem negociar com base nas linhas de negociação de preços. Principais Características O sistema busca automaticamente as áreas de oferta e demanda na linha K. O sistema também desenhará linhas de preços-chave em tempo real, e os traders poderão negociar com base nas linhas de negociação de preços. Port

Tento jedinečný indikátor vám ukazuje rozsah, v ktorom sa pohybujú maloobchodní klienti. Spravidla, ak sa cena udržiava na priemernej úrovni, neskôr dosiahne vrchol a potom sa vráti na opačnú stranu. Indikátor je vhodný pre všetky grafy s možnosťou nastavenia pákového efektu, teda ak zoberieme do úvahy, že retailoví klienti sa pohybujú na trhu s pákovým efektom 500 až 100 páka. Indikátor je vhodný pre väčšie časové rámce H1,H4... s väčšími pákami 100,50,25 ale aj pre malé grafy M5,M15 s pákami

A arca Funcionalidades Principais Identificação Automática de Zonas Críticas
O A arca identifica e destaca automaticamente as regiões de suporte e resistência no gráfico, facilitando a visualização de pontos potenciais de entrada e saída. Sinalização de Entradas e Saídas
Apresenta marcadores de compra e venda, ajudando o trader a definir momentos ótimos para abrir ou fechar posições. Análise Multitimeframe
Integra dados de diferentes períodos (M5, M15, H1 etc.), permitindo a confluência de si
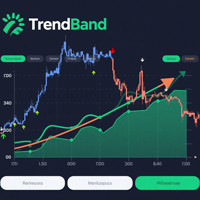
TrendBand Navigator Pro – Non-Repainting Multi-Timeframe Trading System
Powered by proprietary multi-dimensional trend band algorithm delivering clear arrow signals Big Arrows Define Direction Small Arrows Capture Entries Core Advantages
Intelligent Noise Filtering
Volatility-adaptive technology avoids false breakouts, triggers arrows only during strong trends Multi-Timeframe Compatibility
Automatically adapts from 1-minute to monthly charts for all trading strategies Vis

The indicator is based on the calculation of liquidity on the market and thus shows where the market can most likely turn.. It shows the places of liquidity where the price will reach sooner or later... The indicator can be set to several types of liquidity and therefore can display several levels on the graph.. It is a unique tool that can help you very well in your trading The indicator is suitable for currency pairs with the most liquidity (Forex,EURUSD,GBPUSD...) The indicator is suitable fo
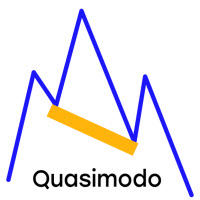
The Quasimodo Pattern Indicator is no more difficult than the Head and Shoulders. Still, only a few traders know about it, and some even confuse one with the other. However, this is not a reason to avoid this tool in your forex trading strategy. Features: Automatic Detection: The indicator automatically scans for valid QM patterns across any timeframe, reducing the need for manual chart analysis. Visual Highlights: Clear and customizable on-chart drawing of shoulders, heads, and breako

The trend indicator processes each bar of the chart and displays signal arrow on it. In the default display settings: red arrow - sell signal blue arrow - buy signal If the arrows are missing on some bars, this means that the algorithm has not identified a consensus on the signal on this bar. The indicator does not have any technical settings for the algorithm. The process of finding a consensus is fully automated.
For ease of visualization on charts, user settings allow you to set the size of
MTRade is a professional arrow indicator based on the classic Parabolic SAR algorithm. It automatically detects the moments of trend direction change and displays clear signal arrows on the chart: up (buy) and down (sell).
Basis: original Parabolic SAR algorithm with full adaptation for visual display by arrows;
Signals: up arrow — possible up reversal (buy); down arrow — possible down reversal (sell);
No redrawing: signals are recorded only after a confirmed reversal, excluding "jumps" and

iMRPHN: Supertrend & Swing Reversal Indicator A trading indicator that integrates Supertrend zone detection with swing-based entry logic. Designed for traders who apply both trend-following and counter-trend approaches. The indicator works across multiple timeframes and offers several helpful visual and alert-based features. Key Features: Automatic identification of swing high and swing low levels Automatic Fibonacci retracement Supertrend reversal zone visualization in real-time Highlights are

Ultimate Trend Rider
Ride the markets with confidence — your all‑in‑one trend‑capturing powerhouse.
Key Features & Benefits Adaptive Multi‑Filter Engine
Combines Supertrend, ADX, ATR volatility, and volume filters to ensure you enter only the strongest, most reliable trends. Multi‑Candle Confirmation
Eliminate “false start” signals: require multiple consecutive closes above/below your trend line before triggering an entry. Customizable Take‑Profit Alerts
Three levels of RSI‑based “TP” mar

O Indicador SMC Sessions é uma ferramenta de precisão desenvolvida para traders de Smart Money que se baseiam em conceitos de TIC, busca por liquidez e estratégias baseadas em sessão . Ele mapeia perfeitamente as zonas críticas de negociação baseadas em sessão, utilizando os conceitos mais comprovados e populares utilizados por traders de nível institucional. Este indicador de sessão completo sobrepõe seu gráfico com as estratégias de intervalo mais eficazes e de alta probabilida
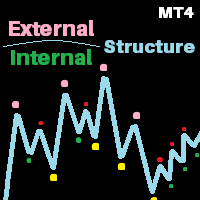
Here is the V3 of perfect market structure. Whats new? Coded based on ICT rules. No more trend confusions...-- Added labels to show current trend No more timeframe juggling and missing out important points, -- Now You can add indicator multiple times to mark multi timeframe market structure on the same chart window( 1D market structure on 4H or may be 4H market structure on 15 min timeframe and more.....) No more waiting in large range as sometimes market makes huge ranges and starts making im
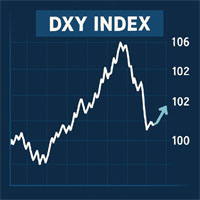
DXY Index indicator to help predict USD effect to your trade. DXY Index will help to see the power of USD.
For example if you trade XAUUSD and the DXY Index weaker, it could be the XAU will be bullish.
The same if DXY Index getting stronger, it could be that XAU will be bearish. I hope this indicator will help many trader to have better position to trade. Use this indicator wisely.

Core Drift Index: Your Reliable Guide in the World of Trading Core Drift Index is an innovative trend indicator designed for precise detection of market directions and reversal points . This powerful tool enables traders to optimize their investments , minimize risk, and maximize profit. Key Features and Benefits Intuitive Trend Detection Core Drift Index clearly shows trend direction, helping traders make timely entry and exit decisions. High Probability of Success With its high accuracy
Warp Range Sensor: The Color of Your Trend Warp Range Sensor is a trend direction indicator that visually displays the current market condition by coloring bars red and blue based on trend direction. What Does Warp Range Sensor Do? Identifies the Current Trend Direction Blue bars indicate an uptrend Red bars signal a downtrend Universal Application
Compatible with all currency pairs and timeframes , from short-term scalping to long-term trading. Powered by Market Context & Historical Data
W
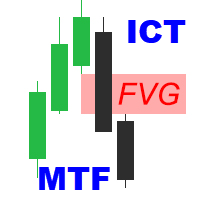
ICT Fair Value Gaps MTF Indicator Unlock the power of Fair Value Gaps (FVGs) across multiple timeframes using the ICT Fair Value Gaps Multi - Timeframe Indicator —a precision tool built for traders who follow the Smart Money Concept (SMC) . Key Features : Multi-Timeframe FVG Detection : Automatically identifies Fair Value Gaps from higher timeframes (M15, H1, H4, etc.) and plots them on your active chart for immediate insight. Break of Structure (BOS) & Change of Character (CHoCH
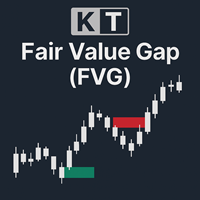
Fair value gap (FVG / ICT) indicator that grades every gap and shows how likely price is to fill it, counted on the symbol and timeframe you trade. Most FVG indicators fill the chart with boxes and leave you guessing which one matters. Here each open gap carries its grade and its fill odds, and a panel records how often each grade of gap held on your own chart. Key features Grades A, B and C: each fair value gap is graded by its size against the average candle range, with grade A drawn in the bo
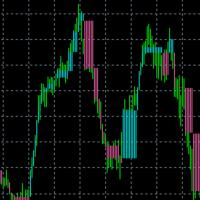
When there is no position, when changing the color, you can consider opening an order. With the fluctuation of the market, when the current color changes again, you need to close the position and leave. Suitable for different cycles, the trading rules are simple and require friends to explore on their own.
I hope friends who use this indicator can make a lot of money, rolling bigger and bigger like a snowball. thank you!
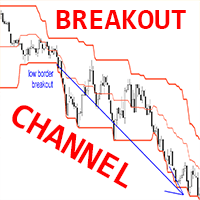
Indicador Crypto_Forex BREAKOUT CHANNEL para MT4, sem repintura. - Este indicador pode ser usado como um sistema de negociação completo baseado em rompimentos de máximas/mínimas. - Possui apenas 1 parâmetro - PROFUNDIDADE HISTÓRICA, que reflete o número de velas consideradas pelo indicador. - Valores recomendados para o parâmetro PROFUNDIDADE HISTÓRICA: período D1 - 20 (um mês), H4 - 30 (uma semana), H1 - 24 (um dia). - O BREAKOUT CHANNEL consiste em 3 linhas: Borda Máxima - preço máximo das úl

Este indicador foi projetado para scalping agressivo e entradas rápidas em opções binárias , gerando sinais em toda vela , para que você saiba exatamente o que está acontecendo o tempo todo.
Junte-se ao canal Happy Scalping: MQL5
Não repinta : o sinal da vela atual é gerado em TEMPO REAL , o que significa que pode mudar enquanto a vela ainda está em formação, dependendo se o preço sobe ou desce em relação ao fechamento da vela anterior.
Mas uma vez que a vela fecha , a cor do sinal fica comple

Indicador Crypto_Forex "RSI SPEED" para MT4 - ótima ferramenta preditiva, sem necessidade de repintura.
- O cálculo deste indicador é baseado em equações da física. O RSI SPEED é a primeira derivada do próprio RSI. - O RSI SPEED é bom para entradas de scalping na direção da tendência principal. - Use-o em combinação com um indicador de tendência adequado, por exemplo, HTF MA (como nas imagens). - O indicador RSI SPEED mostra a rapidez com que o próprio RSI muda de direção - ele é muito sensíve
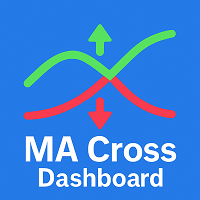
Convenient Dashboard for Moving Average Crossover Trading Strategy . On the panel, numbers display how many candles ago a signal occurred. The number 0 means the signal is on the current candle (it may disappear if the crossover does not hold). The number 1 means the signal was on the previous candle (arrows remain, as moving averages have confirmed the crossover). Moving averages can optionally be added, but the indicator works without them. Advantages of the indicator : Automa
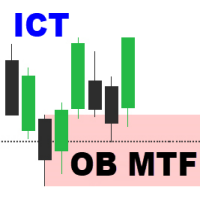
Order Block Multi Timeframe The Order Block Multi Timeframe is a powerful tool for Smart Money Concept (SMC) traders, combining high-accuracy Order Block detection with real-time Break of Structure (BOS) and Change of Character (CHoCH) analysis across multiple timeframes. Smart Money Insight, Multi-Timeframe Precision This indicator automatically identifies institutional Order Blocks —key price zones where large players have entered the market—and plots them directly on your ch

O Indicador de Estratégia de Rompimento da Sessão de Londres foi desenvolvido para traders que seguem os conceitos ICT (Inner Circle Trader) e Smart Money Concepts (SMC) , com foco em buscas por liquidez baseadas em sessões, killzones e comportamento do formador de mercado durante a sessão de Londres. Esta ferramenta captura os níveis de preço mais altos e mais baixos entre 00:00 e 07:00 GMT , comumente identificados como London Killzone ou intervalo do formado

O Indicador de Faixa de Nova York é uma ferramenta de análise baseada em sessão, desenvolvida para traders que aplicam os conceitos de ICT (Inner Circle Trader) , negociação Smart Money e métodos institucionais de ação de preço . Projetado especificamente para a sessão de Nova York, este indicador captura a faixa de preço entre 12h e 14h GMT , um período crítico que se sobrepõe ao Fechamento de Londres e à Abertura de Nova York . Ele identifica as máximas e mínima

GoldStrike Momentum Trend Indicator - The Ultimate Forex Trading Tool Description: Introducing the GoldStrike Momentum Trend Indicator , a powerful and intuitive tool designed for traders seeking precision in their Forex strategies. Using a combination of momentum analysis and the RSI (Relative Strength Index) , this indicator provides buy and sell signals that help you identify optimal entry and exit points, improving your trading decisions. Perfect For: Day traders who need quick, precise sign

O Indicador ICT London Open Killzone é uma ferramenta de negociação baseada em Smart Money , desenvolvida para traders de Forex que seguem conceitos institucionais como ICT, SMC (Smart Money Concepts) e estratégias de estrutura de mercado baseadas em liquidez . Este indicador destaca o London Open Killzone, especificamente das 6h às 8h GMT , uma sessão conhecida por sua volatilidade e deslocamento de preços devido à sobreposição de fluxos de liquidez entre a sessão asi

IMPULSE HUNTER Impulse Hunter é um indicador de trading dinâmico que monitora os movimentos de preço durante as sessões globais mais ativas — Ásia , Londres e Nova York — e destaca os momentos em que o ímpeto rompe níveis-chave. Em vez de depender de suposições, os traders obtêm uma estrutura visual clara : zonas de rompimento baseadas em sessões , metas de take profit escalonadas e níveis de stop-loss adaptáveis ajustados para cada par de moedas. Junte-se ao nosso canal: para ficar atualizado s

One of the advantages of the Arrow Tracker indicator is its vivid visual representation: Histogram Display: Situated beneath the main price chart, the indicator showcases a histogram. This allows for easy identification of market trends. Color-Coded Bars: Uptrends are demarcated with blue bars, whereas downtrends are depicted with pink bars. This differentiation assists traders in swiftly gauging the market’s directional momentum. Signalling Peaks and Bottoms: The histogram employs yellow

Индикатор нейтральной свечи — это инструмент технического анализа, который автоматически определяет зоны нейтральных свечей (neutral candlestick), появляющихся на ценовом графике. Эти зоны, как правило, указывают на неопределённость среди участников рынка и помогают заранее определить возможное направление дальнейшего движения цены. Основные функции: Определяет зоны, где появляются нейтральные свечи. Показывает вероятность движения цены вверх или вниз от этих зон. Помогает трейдеру более точн
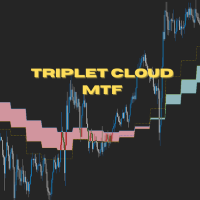
Triplet Cloud MTF is an indicator for trend-following strategy. It presents the trend in HTF from the LTF Chart that allows traders focus on looking for trade entry in the right direction and increase striking rate. It comes with simple input setup. You will only need to choose HTF you want to follow its trend and set the alert setup, then all is set. Here are the mostly selected HTF setup for each of entry timeframe: M1 Entry : M15 Trend M5 Entry : H1 Trend M15 Entry : H4 Trend H1 Entry : D1 Tr

Fibo Bollinger Indicator – MT4 Version Indicator Overview Fibo Bollinger is an advanced technical indicator that combines the dynamic behavior of Bollinger Bands with the power of Fibonacci ratios.
It is specially designed for traders who seek more precise support and resistance zones based on volatility and historical price behavior. Main Features Draws 6 Upper Bands and 6 Lower Bands based on Fibonacci levels. Provides a more detailed view of price volatility compared to traditional B

TradeZones Fibonacci Pro – Zonas Fibonacci dinâmicas e alertas inteligentes de negociação Detecte automaticamente as zonas-chave de reversão usando Fibonacci. Aprimore a precisão das suas entradas. TradeZones Fibonacci Pro é um indicador profissional que traça automaticamente os níveis Fibonacci mais relevantes no seu gráfico, identificando potenciais zonas de compra e venda com base em um período configurável. Com uma interface intuitiva, alertas integrados e um prático botão ON/OFF, ele aju
O WeisWaveScouter é um indicador poderoso e preciso, projetado para ajudar traders a detectar os movimentos mais importantes no mercado com base nas ondas de preço e volume. Desenvolvido para a plataforma MetaTrader 4, o WeisWaveScouter proporciona uma análise detalhada das ondas de alta e baixa, além de destacar os picos de volume, permitindo uma visão clara das condições de mercado. Características principais: Ondas de Alta e Baixa : Identifique facilmente os movimentos ascendentes e descenden
Volume Thermal Vision - Análise Avançada de Volume para MetaTrader 4
Liberte o poder da análise de volume com o Volume Thermal Vision, um indicador sofisticado projetado para aprimorar suas decisões de negociação. Desenvolvido por Jean Roso, esta ferramenta oferece uma visualização dinâmica da intensidade do volume por meio de um mapa de calor personalizável, capacitando os traders a identificar tendências de mercado e potenciais reversões com precisão.
Principais Recursos:
Visualização Mult

O Indicador Killzone do Aberto de Nova York da ICT foi desenvolvido para traders que seguem os Conceitos de Smart Money (SMC) , modelos de negociação da ICT e estratégias baseadas em liquidez no mercado Forex . Esta ferramenta marca o Killzone do Aberto de Nova York , que ocorre das 11h às 14h GMT , um horário crítico em que o volume institucional frequentemente leva a grandes movimentações. O indicador destaca faixas de sessão , faixas de formadores de mercado

Indicator using Zero Length Moving Average and Smooth Heiken Ashi counting (non visual) to help looking the trend is bullish or bearish. Have been tried on XAU/USD pairs and showing when to enter market, BUY or SELL. Have option to showing Arrow if it is good to BUY or to SELL Also have option to give Alert.
Please do not consider this as 100% correct signal. This is just a tool to help trade.
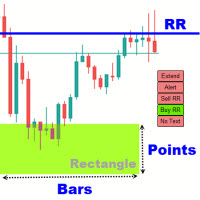
Rectangle Trading Custom is a powerful technical analysis tool designed for price action and range-based traders. It allows users to define consolidation zones and receive alerts when the price breaks out of these zones or approaches trendlines drawn on the chart. Rectangles and Trendlines will be extended into future with one click. Rectangle point size, name and prices will be displayed around rectangle. Key Features: Draw Trading Zones (Rectangle Zones)
Users can manually draw rectangles t

Indicador de Confirmação de Rejeição - Ferramenta de Análise de Ação do Preço Detecção Avançada de Pin Bar e Análise de Reversão do Mercado Este indicador para MT4/MT5 analisa padrões de rejeição de preços, focando especificamente em formações de pin bar para identificar pontos potenciais de reversão do mercado. A ferramenta oferece confirmação visual de sinais de ação do preço baseados em princípios estabelecidos de análise técnica. Método de Análise Central O indicador emprega reconhecimento d
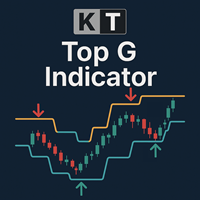
O KT Top G é um indicador baseado em ação do preço que combina análise inteligente de canais para identificar possíveis topos e fundos do mercado. Quando uma possível reversão é detectada, ele exibe setas grandes e claras no gráfico, oferecendo um alerta antecipado antes da virada do mercado. Setas Grandes: Destacam topos e fundos de alta probabilidade ao detectar exaustão do preço e mudança de momentum. Setas Pequenas: Indicam pontos de reversão com menor probabilidade, que frequentemente são r
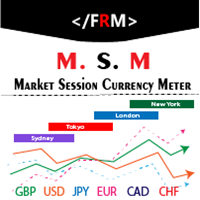
The market session currency meter is an advanced currency meter designed majorly for intra-day trading. The meter tracks price movements and volatilities across the different market sessions daily. With this market meter you will be able to see how price moved within the four (4) major market sessions ( SYDNEY , TOKYO , LONDON and NEW YORK ). The indicator comes with an inbuilt daily savers time adjuster that automatically adjusts the hours for each session when ever the daily savers time (DST)

Pairs Trading Z-Score Optimized is a custom indicator for the MetaTrader 4 (MT4) platform, designed to support pairs trading by analyzing the spread between two currency pairs using Z-Score calculations and stationarity testing. It operates on a single pair (the chart’s symbol and a user-defined second symbol) and displays Z-Score values, threshold bands, and trading signals in a subwindow, with optional arrows on the main chart. The indicator incorporates the Augmented Dickey-Fuller (ADF) test
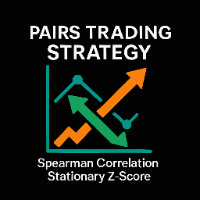
Pair Trading Strategy Based on Spearman Correlation and Stationary Z-Score is A single-pair indicator focusing on one primary symbol (chart symbol) and one secondary symbol for the MetaTrader 4 (MT4) platform, designed to support pairs trading by analyzing the correlation between two currency pairs. It employs Spearman’s rank correlation coefficient, Z-Score calculations, and stationarity testing to generate trading signals, displayed in a subwindow and on the main chart. The indicator integra

How TrendMaster Works TrendMaster is a trading indicator designed to streamline and enhance your chart analysis. Using algorithmic logic, it reviews historical price data to generate a dynamic reference line. When price action crosses this line, a "BUY" or "SELL" signal is displayed on your chart. The goal is to assist in identifying potential shifts in price behavior with a clear and user-friendly visual approach. Why Use TrendMaster? The TrendMaster MT4 Indicator helps highlight potential tre
Pairs Trading Dashboard - Spearman Correlation and Stationary Z-Score is a custom indicator designed for the MetaTrader 4 (MT4) platform, developed to assist traders in analyzing and monitoring currency pairs for pairs trading strategies. It utilizes Spearman’s rank correlation coefficient and Z-Score calculations to identify trading signals across multiple timeframes and currency pairs. The indicator integrates various technical filters and stationarity tests to refine signal generation and di

The Only 100% Universal Tool! Stop trading against nature! This is your chance to secure the only indicator rooted in the absolute laws that govern the entire universe. Most tools guess—this one reveals the truth. Buy another toy or buy the truth. Your choice...
Based on Universal Laws — NOT Some Guy’s Algorithm: Let the market adjust to the Hidden Cycles Geometry — not the other way around.
Most indicators are based on a man-made formula. They often lag, fail over time, or need constant re-o

SISTEMA DE ENTRADA TURBO
Indicadores Cripto de Alta Velocidade – Também Funciona com Pares de Forex
O Sistema de Entrada Turbo foi criado com foco em criptomoedas — especialmente BTC/USD , mas também é totalmente compatível com os principais pares do mercado Forex . Ele é otimizado para scalping de precisão , com indicadores que não repintam e sem atraso entre a ação do preço e o alerta visual.
Sem adivinhações, sem templates, sem lógica oculta . Basta arrastar o indicador para o gráfico e e

Divergence Divergence refers to when the price of a currency pair moves in one direction while the trend indicator is moving in the opposite direction. With divergence, there can be positive and negative signals. Divergences in Forex trading are quite common signals of technical analysis. These are basic early Forex signals indicating the trend reversal and filter false signals. Application of this indicator It is usually not easy to detect divergences by the trader and it may be time-consuming

QuickPivora is a ready-made trading system for scalping. It shows when to open a deal, in which direction to open, when to close a deal. All a trader needs to do is follow the signals and instructions. QuickPivora is a comprehensive trading system that replaces many indicators on the chart, as its signals already take into account the readings of trend indicators, oscillators and channel indicators. The advantage of the QuickPivora trading system is that it is suitable for both beginners and pr
Saiba como comprar um robô de negociação na AppStore do MetaTrader, a loja de aplicativos para a plataforma MetaTrader.
O Sistema de Pagamento MQL5.community permite transações através WebMoney, PayPay, ePayments e sistemas de pagamento populares. Nós recomendamos que você teste o robô de negociação antes de comprá-lo para uma melhor experiência como cliente.

Você está perdendo oportunidades de negociação:
- Aplicativos de negociação gratuitos
- 8 000+ sinais para cópia
- Notícias econômicas para análise dos mercados financeiros
Registro
Login
Você concorda com a política do site e com os termos de uso
Se você não tem uma conta, por favor registre-se