Watch how to order a trading robot
Read the Rules before you post an order or execute it
How to Order a Trading Robot in MQL5 and MQL4
See a sample Requirements Specification to order a robot
New orders in the category:
30+ USD
30 - 20000 USD
30 - 100 USD
50+ USD
Specification
I want an Indicator that :
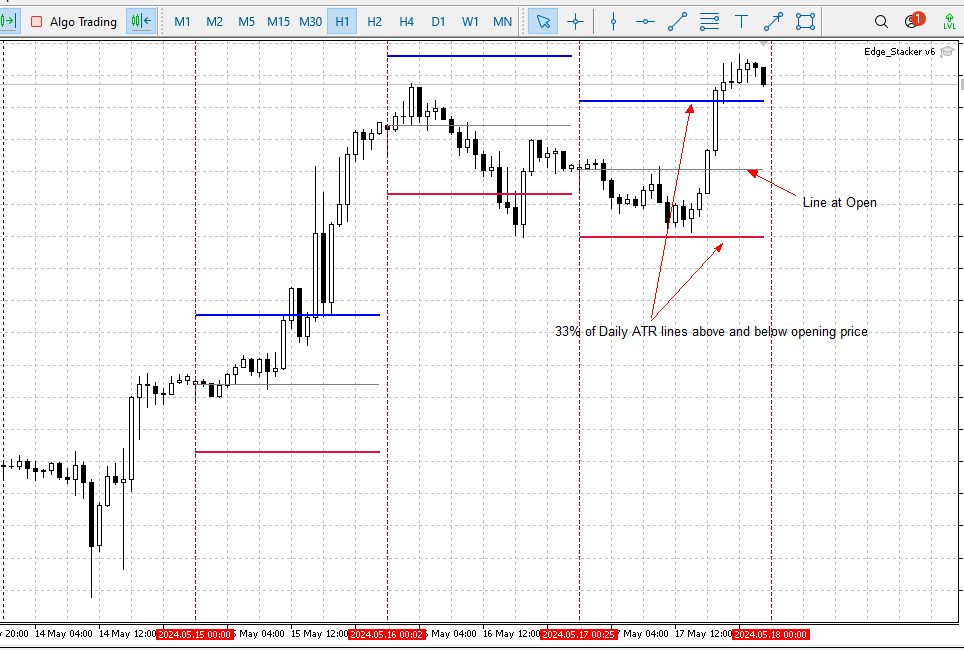
- Draws vertical lines at the opening of candles on a time frames selected.( I want to be able change the candle timeframe the line will be drawn. Eg. I can slelect 1H, 4H etc from the settings, and the vertical line will be drawn at the opening).
- Draw a horizontal line at the opening of the candles in the selected timeframe.
- Calculate the average range of the candles on a selected timeframe. and draw a horizontal line that is 33% of the average range of the candles, above and below the opening price. ( I want to be able to change the % of ATR line to be drawn above and below price).
- Draw a horizotal line above and below the opening price, that is the ATR of the candles selected in point # 1.
- Average range of candles on the timeframe the vertical lines are drawn. ( I want to be able to change the number of candles used to calculate the average from settings)
- Current candles range
- Average range - Current candles range
- Current candles open - High
- Current candles Open - Low
- Current candles Open - current market price
I want to have the right to the source code.
Example of the vertical lines on 1H candles, shown on 1mins chart. Horizontal lines showing Opening price, 33% of ATR lines above and below opening price
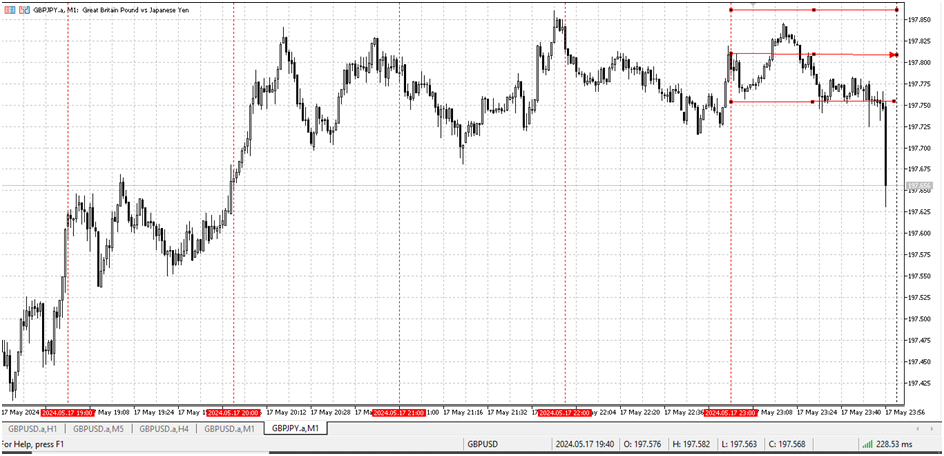
Have a look at the chat below. The vertical lines are drawn at Daily candle open. Lines are drawn above and below the open. The are 33% of Daily ATR.
If i choose 1H or 4H candles, i want it to look like that on lower timeframes. eg 1min or 5mins chart.
Responded
1
Rating
Projects
499
67%
Arbitration
5
40%
/
0%
Overdue
4
1%
Free
Published: 8 codes
2
Rating
Projects
331
29%
Arbitration
36
28%
/
64%
Overdue
10
3%
Working
3
Rating
Projects
35
23%
Arbitration
4
0%
/
50%
Overdue
2
6%
Working
4
Rating
Projects
49
29%
Arbitration
4
25%
/
25%
Overdue
0
Free
5
Rating
Projects
178
25%
Arbitration
24
17%
/
75%
Overdue
16
9%
Working
6
Rating
Projects
246
74%
Arbitration
7
100%
/
0%
Overdue
1
0%
Free
Published: 1 article
7
Rating
Projects
102
23%
Arbitration
12
25%
/
17%
Overdue
13
13%
Free
8
Rating
Projects
553
50%
Arbitration
57
40%
/
37%
Overdue
227
41%
Working
9
Rating
Projects
441
55%
Arbitration
22
50%
/
14%
Overdue
30
7%
Loaded
10
Rating
Projects
9
33%
Arbitration
11
0%
/
100%
Overdue
2
22%
Free
11
Rating
Projects
91
13%
Arbitration
34
26%
/
59%
Overdue
37
41%
Free
12
Rating
Projects
83
45%
Arbitration
27
11%
/
70%
Overdue
8
10%
Free
13
Rating
Projects
25
4%
Arbitration
1
0%
/
0%
Overdue
7
28%
Free
14
Rating
Projects
195
42%
Arbitration
13
8%
/
54%
Overdue
9
5%
Free
Published: 3 codes
Similar orders
Création d'un robot sur MQL5
630 - 640 USD
Bonjour, je recherche un développeur MQL5 expérimenté pour créer un Expert Advisor pour MetaTrader 5 basé sur une stratégie de trading intégrant des principes de gestion des risques rigoureux et d'intelligence financière. Le robot doit être capable de gérer plusieurs paires de devises et d'optimiser automatiquement les entrées et sorties en fonction de conditions de marché prédéfinies."
MT4/MT5 HFT EA us30
30 - 3000 USD
Hello everybody, I'm looking for an experienced MQL4/MQL5 developer to optimize a High-Frequency Trading (HFT) Expert Advisor for both MT4 and MT5. The EA performs consistently and profitably on demo accounts, but when it is run on Raw and Standard live accounts under what appear to be the same trading conditions, it begins generating losses. I do not have the original source code (.mq4/.mq5); I only have the
I'm looking for an experienced NinjaTrader 8 (C#) developer to build a fully automated futures trading strategy. Please apply only if you have proven experience developing and testing NinjaTrader strategies. Project Overview Develop a fully automated NinjaTrader 8 strategy. Designed for Apex funded and evaluation accounts. Primary instruments: NQ/MNQ Futures (with flexibility to support other futures later). Trading
Need an already built EA with proven track record
30 - 1000 USD
Hello I need to purchase the source code of an already built profitable mt5 EA with proven track recordIf you have something similar and you are open to selling the source code please apply to this post Please note I am not looking for a dev to build the product from scratch , but need something that is already built and have at least one year worth of track record
I need an Expert Advisor for MT5 on XAUUSD 1min timeframe using SMC concepts. STRATEGY RULES: SELL: 1. Identify previous day High/Low as liquidity 2. Entry only during London-NY session: 15:00-19:00 GMT+3 or broker clock. 3. If price sweeps previous day High and closes back below it 4. Check for bearish 1min FVG below sweep candle 5. Wait for BOS - lower low 6. Entry: Sell/buy at 50% of the FVG 7. SL: 10 pips above
Code An Loss Rate 90-100% MT5 EA , that can blow a 100 USD account a day ,with fixed TP of 3000 points and SL of 3000 For better Rate Calculations get an strategy that can lead to so
8 cap prop firm passing
30 - 3000 USD
I am looking for an experienced MQL4/MQL5 HFT developer to build or optimize a High-Frequency Trading (HFT) Expert Advisor that can successfully pass proprietary trading firm challenges and perform consistently under live trading conditions with brokers such as 8cap or BlackBull Markets . The developer should have proven experience with HFT execution, ultra-low-latency trading, broker execution, slippage, spreads
I need a professional MT5 Expert Advisor (MQL5) for XAU/USD (Gold) only. Requirements: - Symbol: XAU/USD only - Timeframe: H1 trend, M5 entry - Smart Money Concept (SMC) - Liquidity Sweep - Break of Structure (BOS) - Order Block Retest - Confirmation Candle (Engulfing or Pin Bar) - ATR-based Stop Loss - Risk:Reward = 1:3 (adjustable) - Auto Lot (1% risk) - Break Even - Trailing Stop - Maximum 2 trades per day - One
Hello, I am looking for an existing, fully backtestable MT5 Expert Advisor or EA portfolio designed specifically for passing an FTMO-style prop-firm evaluation. I am not looking for unrealistic profit claims or a visually perfect backtest. My priority is a statistically defensible probability of passing the challenge while respecting all risk limits. Primary objective The system should be designed for the current
MT4/MT5 HFT EA Live Trading
40 - 10000 USD
I have a High-Frequency Trading (HFT) Expert Advisor for both MT4 and MT5 designed primarily for US30 (Dow Jones Index) . The EA performs consistently and profitably on demo accounts, but when I run it on an IC Markets Raw or Standard live account, it starts generating losses under what appear to be the same trading conditions. At this time, I cannot provide the source code (.mq4/.mq5). I can only provide the
Project information
Budget
30 - 40 USD
Deadline
from 1 to 5 day(s)