Voir comment commander un robot de trading
Lisez les Règles avant de passer une commande ou de l'exécuter
Comment commander un robot de trading dans MQL5 et MQL4
Voir un exemple de spécification des exigences pour commander un robot
Nouvelles commandes dans la catégorie:
30+ USD
30 - 20000 USD
30 - 100 USD
50+ USD
Spécifications
I want an Indicator that :
- Draws vertical lines at the opening of candles on a time frames selected.( I want to be able change the candle timeframe the line will be drawn. Eg. I can slelect 1H, 4H etc from the settings, and the vertical line will be drawn at the opening).
- Draw a horizontal line at the opening of the candles in the selected timeframe.
- Calculate the average range of the candles on a selected timeframe. and draw a horizontal line that is 33% of the average range of the candles, above and below the opening price. ( I want to be able to change the % of ATR line to be drawn above and below price).
- Draw a horizotal line above and below the opening price, that is the ATR of the candles selected in point # 1.
- Average range of candles on the timeframe the vertical lines are drawn. ( I want to be able to change the number of candles used to calculate the average from settings)
- Current candles range
- Average range - Current candles range
- Current candles open - High
- Current candles Open - Low
- Current candles Open - current market price
I want to have the right to the source code.
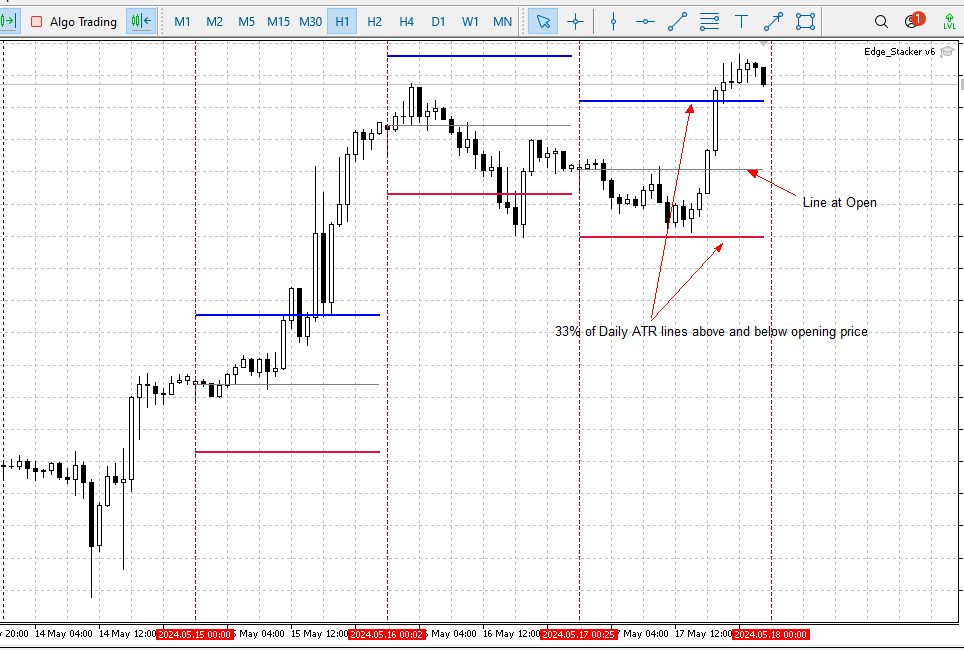
Example of the vertical lines on 1H candles, shown on 1mins chart. Horizontal lines showing Opening price, 33% of ATR lines above and below opening price
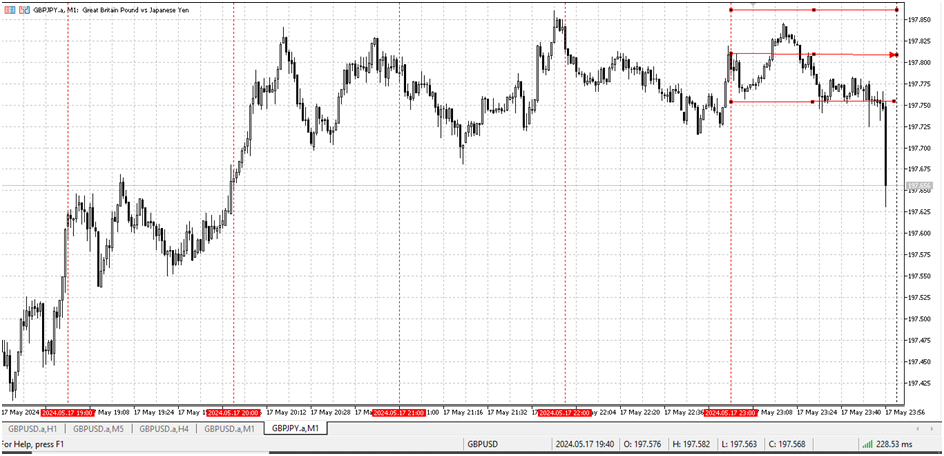
Have a look at the chat below. The vertical lines are drawn at Daily candle open. Lines are drawn above and below the open. The are 33% of Daily ATR.
If i choose 1H or 4H candles, i want it to look like that on lower timeframes. eg 1min or 5mins chart.
Répondu
1
Évaluation
Projets
499
67%
Arbitrage
5
40%
/
0%
En retard
4
1%
Gratuit
Publié : 8 codes
2
Évaluation
Projets
331
29%
Arbitrage
36
28%
/
64%
En retard
10
3%
Travail
3
Évaluation
Projets
35
23%
Arbitrage
4
0%
/
50%
En retard
2
6%
Travail
4
Évaluation
Projets
49
29%
Arbitrage
4
25%
/
25%
En retard
0
Gratuit
5
Évaluation
Projets
178
25%
Arbitrage
24
17%
/
75%
En retard
16
9%
Travail
6
Évaluation
Projets
246
74%
Arbitrage
7
100%
/
0%
En retard
1
0%
Gratuit
Publié : 1 article
7
Évaluation
Projets
102
23%
Arbitrage
12
25%
/
17%
En retard
13
13%
Gratuit
8
Évaluation
Projets
553
50%
Arbitrage
57
40%
/
37%
En retard
227
41%
Travail
9
Évaluation
Projets
441
55%
Arbitrage
22
50%
/
14%
En retard
30
7%
Chargé
10
Évaluation
Projets
9
33%
Arbitrage
11
0%
/
100%
En retard
2
22%
Gratuit
11
Évaluation
Projets
91
13%
Arbitrage
34
26%
/
59%
En retard
37
41%
Gratuit
12
Évaluation
Projets
83
45%
Arbitrage
27
11%
/
70%
En retard
8
10%
Gratuit
13
Évaluation
Projets
25
4%
Arbitrage
1
0%
/
0%
En retard
7
28%
Gratuit
14
Évaluation
Projets
195
42%
Arbitrage
13
8%
/
54%
En retard
9
5%
Gratuit
Publié : 3 codes
Commandes similaires
Création d'un robot sur MQL5
630 - 640 USD
Bonjour, je recherche un développeur MQL5 expérimenté pour créer un Expert Advisor pour MetaTrader 5 basé sur une stratégie de trading intégrant des principes de gestion des risques rigoureux et d'intelligence financière. Le robot doit être capable de gérer plusieurs paires de devises et d'optimiser automatiquement les entrées et sorties en fonction de conditions de marché prédéfinies."
MT4/MT5 HFT EA us30
30 - 3000 USD
Hello everybody, I'm looking for an experienced MQL4/MQL5 developer to optimize a High-Frequency Trading (HFT) Expert Advisor for both MT4 and MT5. The EA performs consistently and profitably on demo accounts, but when it is run on Raw and Standard live accounts under what appear to be the same trading conditions, it begins generating losses. I do not have the original source code (.mq4/.mq5); I only have the
8 cap prop firm passing
30 - 3000 USD
I am looking for an experienced MQL4/MQL5 HFT developer to build or optimize a High-Frequency Trading (HFT) Expert Advisor that can successfully pass proprietary trading firm challenges and perform consistently under live trading conditions with brokers such as 8cap or BlackBull Markets . The developer should have proven experience with HFT execution, ultra-low-latency trading, broker execution, slippage, spreads
Hello, I am looking for an existing, fully backtestable MT5 Expert Advisor or EA portfolio designed specifically for passing an FTMO-style prop-firm evaluation. I am not looking for unrealistic profit claims or a visually perfect backtest. My priority is a statistically defensible probability of passing the challenge while respecting all risk limits. Primary objective The system should be designed for the current
MT4/MT5 HFT EA Live Trading
40 - 10000 USD
I have a High-Frequency Trading (HFT) Expert Advisor for both MT4 and MT5 designed primarily for US30 (Dow Jones Index) . The EA performs consistently and profitably on demo accounts, but when I run it on an IC Markets Raw or Standard live account, it starts generating losses under what appear to be the same trading conditions. At this time, I cannot provide the source code (.mq4/.mq5). I can only provide the
Version document : 1.0 Plateforme : TradingView Langage : Pine Script v6 Type : Indicateur d'analyse et d'aide à la décision (non-exécutant) 1. Présentation du projet Nom du produit ONYX SR V2 — Intelligent Support & Resistance Scalping System Objectif Créer un indicateur TradingView capable d'identifier automatiquement des opportunités de scalping basées sur : supports et résistances dynamiques ; action du prix ;
Fundamental News Trading Strategy
50 - 200 USD
I want to build a fundamental news trading bot that trade off economic news data, as we know every economic news data released always have effect on the asset associated with it, so this bot will take a trade instantly based on the news data released either to buy or sell, it will come with good money management and also SL and TP target based on price and pips value
TumiiFX
30 - 20000 USD
1. Use two EMAs: 20 and 50. If EMA 20 is above EMA 50 → uptrend (look for buys) If EMA 20 is below EMA 50 → downtrend (look for sells) 2. Wait for a pullback into the area between the two EMAs. - For buys: price must touch or move between EMA 20 and EMA 50 during the last few candles. - For stils: same idea, but in a downtrend. 3. Entry signal: Buy: a bullish engulfing candle in an uptrend after the pullback
Ниже представлено готовое, технически выверенное Техническое задание (ТЗ) . Вы можете полностью скопировать этот текст и разместить его на бирже фриланса (например, MQL5.com в разделе «Фриланс» или на Smart-Lab). Данное ТЗ написано на профессиональном языке, понятном разработчикам торговых систем для терминала QUIK (на языке Lua) . ТЕХНИЧЕСКОЕ ЗАДАНИЕ (ТЗ) Разработка мультивалютного торгового робота для терминала
Bot
30 - 80 USD
I am looking for an experienced MQL5 developer to create a fully automated Expert Advisor (EA) for MetaTrader 5 based on a Price Action strategy. The bot needs to automatically identify specific candlestick formations and market structure levels, execute trades, and manage risk using a dynamic trailing stop.The EA should monitor the chart for the following price action setup:Market Structure / Trend Filter:The bot
Informations sur le projet
Budget
30 - 40 USD
Délais
de 1 à 5 jour(s)