Market Condition Evaluation based on standard indicators in Metatrader 5 - page 169
You are missing trading opportunities:
- Free trading apps
- Over 8,000 signals for copying
- Economic news for exploring financial markets
Registration
Log in
You agree to website policy and terms of use
If you do not have an account, please register
Forum on trading, automated trading systems and testing trading strategies
Forecast for Q2'16 - levels for S&P 500
Sergey Golubev, 2016.04.23 17:18
S&P 500 Technical Analysis 2016, 24.04 - 01.05: bullish ranging within narrow s/r levels
Daily price is on bullish market condition located above Ichimoku cloud and above Senkou Span line which is the virtual border between the primary bearish and the primary bullish trend on the chart. The price is ranging within narrow support/resistance level for the bullish trend to be continuing or to the secondary correction to be started.
The price is ranging within the following key support/resistance lines:
Chinkou Span line is located above the price indicating the bullish trend to be continuing, and Absolute Strange indicator is evaluating the price movement as the secondary ranging condition to be continuing.
If D1 price will break 2039.14 support level on close bar so the local downtrend as the secondary correction within the primary bullish market condition will be started.If D1 price will break 2110.83 resistance level on close bar from below to above so the bullish trend will be continuing.
If not so the price will be on ranging within the levels.
Forum on trading, automated trading systems and testing trading strategies
Forecast for Q2'16 - levels for EUR/USD
Sergey Golubev, 2016.04.24 09:59
EURUSD Technical Analysis 2016, 24.04 - 01.05: secondary correction to the breakdown with bearish reversal
Daily price is on bullish market condition located to be above Ichimoku cloud: the price is breaking 1.1233 support level for the secondary correction to be started with crossing the symmetric triangle pattern to below with Chinkou Span line to be breaking the price for the good possible breakdown. There are the following key support/resistance levels for the price:
Chinkou Span line is crossing the price to below on open daily bar for the possible breakdown, and Absolute Strange indicator is evaluating the price movement as the secondary correction.
If D1 price will break 1.1233 support level on close bar so the secondary correction within the primary bullish will be started.
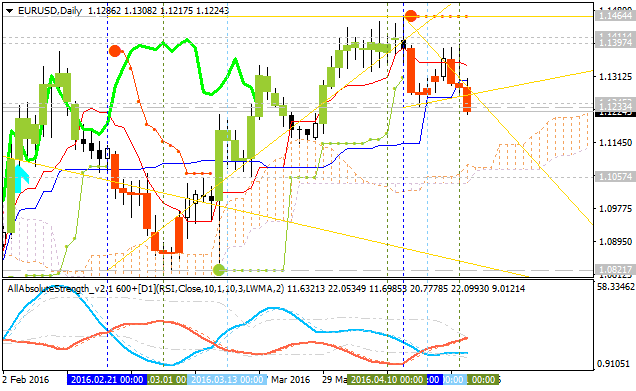
If D1 price will break 1.1057 support level on close bar from above to below so we may see the reversal of the price movement from the ranging bullish to the primary bearish market condition.
If D1 price will break 1.1464 resistance level on close bar so the primary bullish trend will be continuing.
If not so the price will be on ranging within the levels.
SUMMARY : primary bullish
TREND : secondary correctionForum on trading, automated trading systems and testing trading strategies
Forecast for Q2'16 - levels for USD/JPY
Sergey Golubev, 2016.04.24 17:10
Weekly Forecast: the most interesting pair you can make money with - USD/JPY
USD/JPY: possible breakout with bullish reversal. The pair is on breakout which was started on Friday - the price broke 2 key resistance levels on open daily bar testing 112.77 resistance level to above for the breakout to be continuing. There are 4 simple scenarios for the price movement for the week:
Chinkou Span line is crossing the price to above on open daily bar together with Absolute Strength indicator estimating the breakout to be continuingn in the near future.
There are the following news events which will be affected on USD/JPY price movement for the week:
Forum on trading, automated trading systems and testing trading strategies
Forecast for Q2'16 - levels for Hang Seng Index (HSI)
Sergey Golubev, 2016.04.25 06:53
Hang Seng Index Technical Analysis 2016, 24.04 - 01.05: bullish ranging within new narrow s/r levels
Daily price is on bullish market condition located above Ichimoku cloud: the price is ranging within narrow support/resistance levels for the bullish trend to be continuing or for the secondary correction to be started. There are the folllwing key s/r levels:
- 21,666 key resistance level located far above Ichimoku cloud in the primary bullish area of the chart,
- 21,025 key support level located in the beginning of the secondary correction to be started, and
- 20,128 key support level located in the beginning of the primary bearish area of the chart.
Absolute Strength indicator is estimating the ranging condition to be continuing, and Chinkou Span line is located above the price for the ranging bullish condition to be continuing in the near future.If D1 price will break 21,025 support level on close bar so the local downtrend as the secondary correction within the primary bullish trend will be started.
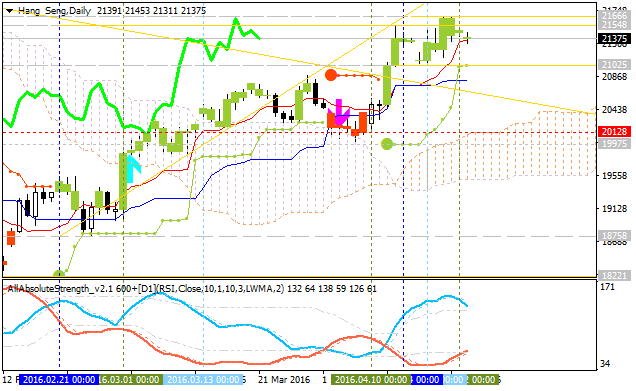
If D1 price will break 20,128 support level on close bar so we may see the reversal of the price movement from the primary bullish to the ranging bearish market condition.
If D1 price will break 21,666 resistance level on close bar so the bullish trend will be continuing without ranging.
If not so the price will be on ranging within the levels.
SUMMARY : bullish
TREND : rangingForum on trading, automated trading systems and testing trading strategies
Forecast for Q2'16 - levels for EUR/USD
Sergey Golubev, 2016.04.25 13:20
Anyway, there are at least 4 high impacted news events which will be affected on EUR/USD price movement for the week so we can expect more good quick movement on breakout/breakdown way I hope:Just some theory to remind :
Forum on trading, automated trading systems and testing trading strategies
USDJPY Technical Analysis 23.06 - 30.06 : Rally Finishing to Ranging
Sergey Golubev, 2013.06.27 12:07
Well ... what I am explaining here by text and charts - it is understandable for traders. But there are traders and coders on the forum. And I think we all know that they are using different "forex english" in some cases. So, I am just translating some terms/words I am using for technical Ichimoku analysis onto "coding english" language :) :
Forum on trading, automated trading systems and testing trading strategies
Market Condition Evaluation based on standard indicators in Metatrader 5
Sergey Golubev, 2013.06.28 18:00
Hi zeno,
as to lower timeframe ... the default settings of Ichimoku is 9/26/52, right? But it is mainly for higher timeframe (started from H1 for example). For lower timeframe - there are 2 kinds of settings:
=========
Besides, there are many signals of Ichimoku indicator to open the trades. I know about 6 signals (but it is much more signals in combination with each other):
The combination of all those 6 signals = Ichimoku indicator.
So, the request about alert ... it is the request to create alet for all those signals with combination with each other? if yes so it is big project ... I do not have the credits in my profile for all those alerts (which may be - more than 100 different variations) :) ... if you are talking about some particular signal so - it may be possible to make alert.
I am mostly using on the thread just one signal : Chikou Span crossing historical price. So, which signal to be alert?
Forum on trading, automated trading systems and testing trading strategies
Something Interesting in Financial Video May 2014
Sergey Golubev, 2014.05.12 08:54
Ichimoku Kinko Hyo Trading System
A brief look at the terminology, signals and methods for taking trades using Ichimoku Kinko Hyo.
More video on this subject:
==============
Ichimoku threads/posts on mql5.com forum
=============
Ichimoku indicator description
=============
Forum on trading, automated trading systems and testing trading strategies
Press review
Sergey Golubev, 2016.04.26 12:09
Technical Targets for EUR/USD by United Overseas Bank (based on the article)
EUR/USD: ranging, or bearish reversal by 1.1143 level to be broken
H4 price is located below 100 period SMA (100 SMA) with near and above 200 period SMA (200 SMA) for the ranging market condition waiting for direction within the following key reversal support/resistance levels:
If the price breaks 1.1397 level to below so we may see the bullish trend on intra-day chart, and if the price breaks 1.1217 level to below so the bearish trend will be continuing.
Daily price is located above 100/200 SMA for the bullosh market condition with the ranging within 1.1464 bullish Fibo resistance level and 50.0% Fibo support level at 1.1143. If the price breaks 1.1143 to below so the veresal of the price movement to the primary bearish market condition will be started.
Anyway, United Overseas Bank is considering the EUR/USD intra-day price to be in bearish condition, and the daily price to be turned to the bearish condition as well by breaking 1.1143 level (1.1145 by UOB) to below. But UOB estimated this level as the very strong one so the ranging market condition for this pair is having good probability in the future as well.
"The downward momentum is not as impulsive as we would like. Furthermore, the target of 1.1145 is a strong support and EUR would likely struggle to move clearly below this level. Those who are short should look to take partial profit at 1.1145."
Forum on trading, automated trading systems and testing trading strategies
Forecast for Q2'16 - levels for GOLD (XAU/USD)
Sergey Golubev, 2016.04.26 12:32
GOLD (XAU/USD) Intra-Day Price Action Analysis - bearish ranging on bullish reversal area
H4 price was on breakdown with the bearish reversal: price broke 100 SMA/200 SMA reversal levels for the bearish market condition with the secondary ranging to be started within the following key support/resistance levels:
RSI indicator is estimating the ranging bearish market condition to be continuing.
If the price will break Fibo support level at 1,227.32 so the primary bearish trend will be continuing without secondary ranging.
If the price will break 50.0% Fibo resistance level at 1,248.79 from below to above so we may see the reversal of the price movement from the ranging bearish to the primary bullish market condition.
If not so the price will be ranging within the levels.
Forum on trading, automated trading systems and testing trading strategies
Press review
Sergey Golubev, 2016.04.26 14:50
EUR/USD Intra-Day Fundamentals: U.S. Durable Goods Orders and 36 pips price movement
2016-04-26 12:30 GMT | [USD - Durable Goods Orders]
if actual > forecast (or previous one) = good for currency (for USD in our case)
[USD - Durable Goods Orders] = Change in the total value of new purchase orders placed with manufacturers for durable goods.
==========
EUR/USD M5: 36 pips price movement by U.S. Durable Goods Orders news event :
Forum on trading, automated trading systems and testing trading strategies
Press review
Sergey Golubev, 2016.04.27 08:09
AUD/USD Intra-Day Fundamentals: Australian CPI and 107 pips price movement
2016-04-27 01:30 GMT | [AUD - CPI]
if actual > forecast (or previous one) = good for currency (for AUD in our case)
[AUD - CPI] = Change in the price of goods and services purchased by consumers.
==========
==========
AUD/USD M5: 107 pips price movement by Australian CPI news event :