Market Condition Evaluation based on standard indicators in Metatrader 5 - page 172
You are missing trading opportunities:
- Free trading apps
- Over 8,000 signals for copying
- Economic news for exploring financial markets
Registration
Log in
You agree to website policy and terms of use
If you do not have an account, please register
Forum on trading, automated trading systems and testing trading strategies
Press review
Sergey Golubev, 2016.05.06 12:01
Trading the News: U.S. Non-Farm Payrolls (based on the article)
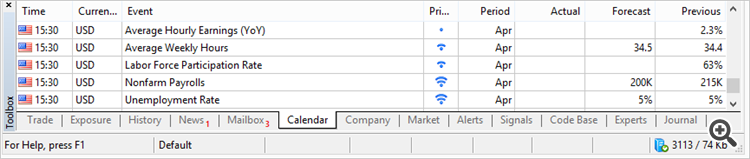
What’s Expected:
Why Is This Event Important:
With the U.S. economy approaching ‘full-employment,’ a further improvement in the labor market paired with signs of stronger wage growth may put increased pressure on the Federal Open Market Committee (FOMC) to raise the benchmark interest rate at the next quarterly meeting in June as the central bank risks falling behind the curve.
Nevertheless, waning business confidence along with the slowdown in household consumption may prompt U.S. firms to scale back on hiring, and a dismal employment report may drag on the U.S. dollar as market participants push out bets for higher borrowing-costs.
How To Trade This Event Risk
Bullish USD Trade: NFP Expands 200K+, Jobless Rate Narrows
- Need red, five-minute candle following the NFP print to consider a short trade on EUR/USD.
- If market reaction favors a bullish dollar trade, sell EUR/USD with two separate position.
- Set stop at the near-by swing high/reasonable distance from entry; look for at least 1:1 risk-to-reward.
- Move stop to entry on remaining position once initial target is hit; set reasonable limit.
Bearish USD Trade: U.S Employment Report Falls Short of Market Expectations- Need green, five-minute candle to favor a long EUR/USD trade.
- Implement same setup as the bullish dollar trade, just in the opposite direction.
Potential Price Targets For The ReleaseEURUSD Daily
Forum on trading, automated trading systems and testing trading strategies
Press review
Sergey Golubev, 2016.05.07 09:29
Week Ahead: Dollar Index Technical Analysis - daily ranging bearish, weekly ranging near reversal; what's next? (based on the article)
---
Daily price is located below SMA with period 100 (100 SMA) and SMA with the period 200 (200 SMA) for the bearish market condition: the price is ranging within 91.92 support level and 94.81 resistance level with RSI indicator estimating the ranging bearish trend to be continuing in the near future. Bullish reversal resistance level is 96.40, and if the price breaks this level to above so the reversal of the price movement to the primary bullish market condition will be started.
---
Weekly price is on secondary correction within the primary bullish trend: the price is testing 93.01 support level together with 100 SMA to below on close weekly bar for the secondary correction to be continuing and with 82.51 as the next bearish reversal target. But if the price breaks 100.51 resistance to above on close weekly bar so the primary bullish trend will be continuing, otherwise - ranging near reversal levels.
Forum on trading, automated trading systems and testing trading strategies
Forecast for Q2'16 - levels for USD/JPY
Sergey Golubev, 2016.05.07 11:44
USD/JPY Technical Analysis 2016, 08.05 - 15.05: daily bearish within narrow levels; weekly bearish breakdown; monthly correction; 106.27 is the key
The Short-Term situation. Daily price was on the bearish breakdown since end of April this tear: price broke key support levels to below on the way to go to downtrend which was started from Senkou Span line and stopped by 106.27 support level. For now, the price is on narrow ranging within the following s/r levels:
If D1 price will break 106.27 support level on close bar so the primary bearish trend will be continuing with 105.54 nearest target to re-enter.
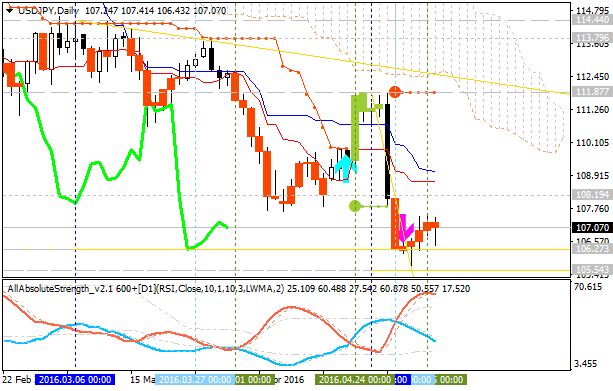
If D1 price will break 108.19 resistance level on close bar so the local uptrend as the bear market rally will be started.
If not so the price will be on ranging within the levels.
The Medium-Term situation. Weekly price is on the bearish breakdown since end of January this year: price broke key support levels together with Ichimoku cloud to below with 106.27 support level to be tested for the bearish breakdown to be continuing.
The Long-Term situation. Monthly price is on secondary correction which was started in the beginning of February this year with 106.27 support level testing for the correction to be continuing.
Forum on trading, automated trading systems and testing trading strategies
Forecast for Q2'16 - levels for SILVER (XAG/USD)
Sergey Golubev, 2016.05.07 14:35
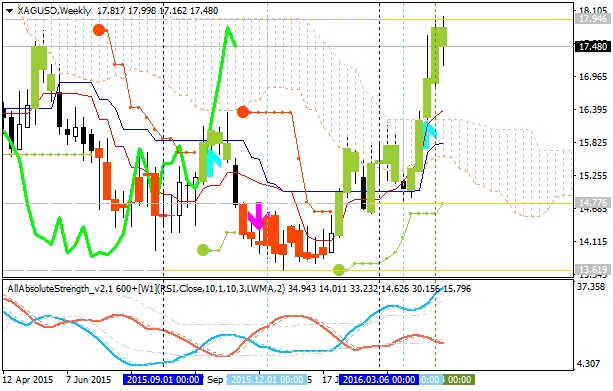
SILVER (XAG/USD) Technical Analysis 2016, 08.05 - 15.05:
Daily price is on bullish market condition located above Ichimoku cloud and above Senkou Span line which is the virtual border between the primary bearish and the primary bullish trend on the chart. The price was bonced from 17.94 resistance level for the ranging condition to be started within 17.94/16.81 levels. Absolute Strength indicator is estimating the ranging bullish condition, and Chinkou Span line is located above the price for the bullish trend to be continuing by direction.
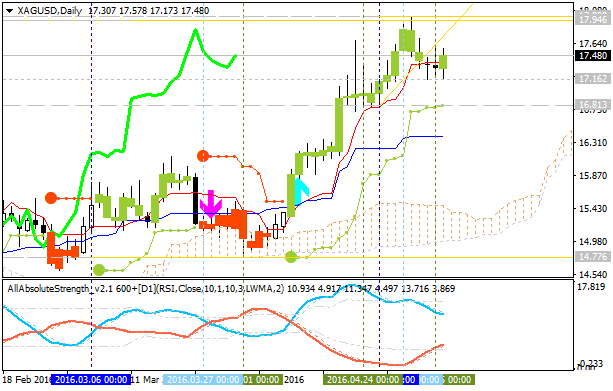
If D1 price will break 16.81 support level on close bar so the local downtrend as the daily secondary correction within the primary bullish market condition will be started.
If D1 price will break 17.94 resistance level on close bar so the bullish trend will be continuing without ranging.
If not so the price will be on ranging within the levels.
Weekly price is on bullish breakout: the price is testing 17.94 resistance level for the breakout to be continuing, otherwise - ranging bullish.
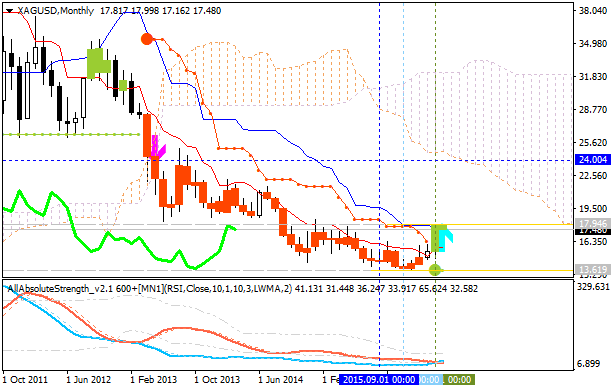
Monthly price is local uptrend as a market rally within the primary bearish market condition: the resistance level at 17.94 will be going to be broken for the rally to be continuing.
SUMMARY : daily ranging bullish; weekly bullish breakout; monthly bear market rally
Forum on trading, automated trading systems and testing trading strategies
Forecast for Q2'16 - levels for S&P 500
Sergey Golubev, 2016.05.09 10:07
S&P 500 Technical Analysis: bullish ranging breakdown
Daily price is on bullish ranging breakdown: the price is on secondary correction by breaking key support levels with the Chinkou Span line which was crossed the price to below in the ranging way of direction. Symmetric triangle pattern was broken by the price to below for the secondary correctional breakdown to be continuing, and Absolute Strength indicator is estimating the ranging condition to be started.
If D1 price will break 2030.25 support level on close bar so the reversal of the price movement from the primary bullish to the ranging bearish market condition will be started.If D1 price will break 2104.75 resistance level on close bar from below to above so the bullish trend will be continuing.
If not so the price will be on ranging within the levels.
Forum on trading, automated trading systems and testing trading strategies
Forecast for Q2'16 - levels for Hang Seng Index (HSI)
Sergey Golubev, 2016.05.09 10:17
Hang Seng Index Technical Analysis: key support level at 19,891 to be broken for the bearish reversal
Daily price is located below 200-day SMA for the 100-day SMA crossing to below with the 19,891 level to be broken for the bearish reversal to be started without ranging.
Forum on trading, automated trading systems and testing trading strategies
Press review
Sergey Golubev, 2016.05.09 13:25
AUD/USD Technical Analysis: 50.0% Fibo level to be crossed to below for the daily bearish reversal to be started (adapted from the article)
Forum on trading, automated trading systems and testing trading strategies
Press review
Sergey Golubev, 2016.05.09 13:25
AUD/USD Technical Analysis: 50.0% Fibo level to be crossed to below for the daily bearish reversal to be started (adapted from the article)
Forum on trading, automated trading systems and testing trading strategies
Press review
Sergey Golubev, 2016.05.10 07:19
USD/CNH Intra-Day Fundamentals: China's Producer Price Index and 28 pips price movement
2016-05-10 01:30 GMT | [CNY - PPI]
if actual > forecast (or previous one) = good for currency (for CNH in our case)
[CNY - PPI] = Change in the price of goods purchased and sold by producers.
==========
USDCNH M5: 28 pips price movement by China's Producer Price Index news event :
Forum on trading, automated trading systems and testing trading strategies
Press review
Sergey Golubev, 2016.05.10 11:25
EUR/USD Intra-Day Fundamentals: FOMC Member Dudley Speech and 16 pips price movement
2016-05-10 07:15 GMT | [USD - FOMC Member Dudley Speaks]
[USD - FOMC Member Dudley Speaks] = Speech in a panel discussion about the international monetary system, in Zurich.
==========
"The dollar’s dominant reserve currency status has sometimes been referred to as the United States’ “exorbitant privilege,” implying that the U.S. benefits extraordinarily from this privileged status. I’d argue that the situation is much more nuanced. Yes, this status does allow the U.S. to benefit from seigniorage. More than half of all U.S. currency outstanding is held abroad. But, there are also costs of being the dominant reserve currency. For example, this can lead to shifts in the valuation of the dollar that are due primarily to developments abroad that affect risk appetites and international capital flows. In such cases, the dollar’s valuation can be pushed to levels inconsistent with U.S. economic fundamentals.
I welcome other countries’ progress toward achieving the preconditions necessary for their currencies to attain the stature of a reserve currency. However, we should not act as if this is sufficient to achieve a well-functioning global financial system. In particular, the current regime is inefficient in a number of important ways. Countries have found it necessary to self-insure against the risk of large capital flow reversals. This has led to a very sharp rise in aggregate foreign exchange reserve holdings. This form of self-insurance is very expensive—especially when the return on the foreign exchange reserve portfolio is less than the cost of the domestic liabilities that fund these holdings. As I have said in the past, I encourage more work to examine whether there are other more efficient regimes that, for example, would economize on required foreign exchange reserve buffers. In this regard, I think expanding the capacity of the IMF’s resources and working to further de-stigmatize drawing on the IMF’s liquidity facilities could be worthwhile steps in this direction."
==========
EUR/USD M5: 16 pips price movement by FOMC Member Dudley Speech news event :