Market Condition Evaluation based on standard indicators in Metatrader 5 - page 175
You are missing trading opportunities:
- Free trading apps
- Over 8,000 signals for copying
- Economic news for exploring financial markets
Registration
Log in
You agree to website policy and terms of use
If you do not have an account, please register
Forum on trading, automated trading systems and testing trading strategies
Forecast for Q2'16 - levels for DAX Index
Sergey Golubev, 2016.05.20 20:26
DAX Index: End Of Week Technicals - daily ranging for direction
This trading week ended with some results and setups - daily ranging within 100 SMA/200 SMA waiting for direction, and ranging bearish market condition
------------------
DAX Index
D1 price is on secondary ranging within 7-day high/low for the waiting for the dierection of the trend: the price is is located to be between 100 SMA and 200 SMA within 10,085.8 resistance and 9,762.4 support levels.
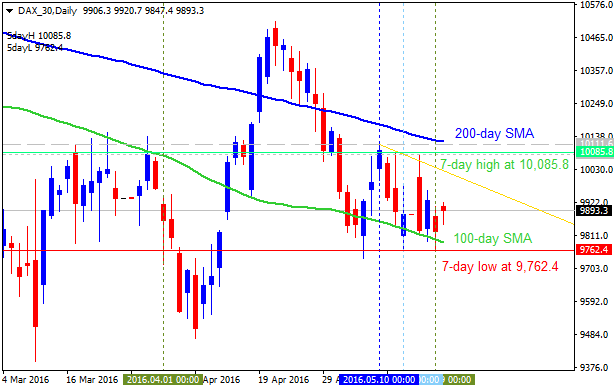
If the price will break 7-day high at 10,085.8 to above on daily close bar so the daily bullish reversal will be started.If the price will break 7-day low at 9,762.4 from above to below so the bearish market condition will be continuing without secondary ranging up to the new bottom to be formed.
If not so the price will be on ranging for direction.
SUMMARY : waiting for direction
TREND : rangingForum on trading, automated trading systems and testing trading strategies
Forecast for Q2'16 - levels for EUR/USD
Sergey Golubev, 2016.05.22 10:28
EURUSD Technical Analysis 2016, 22.05 - 29.05: ranging within Ichimoku cloud waiting for direction
Daily price is located to be inside Ichimoku cloud for the secondary ranging condition within the primary bullish: the price is testing 1.1179 and 1.1143 support levels to below for the daily bearish reversal with Absolute Strength indicator and Trend Strergn indicator which are estimating the bearish condition for the price ion the near future.
If D1 price will break 1.1143 support level on close bar so the reversal of the price movement from the ranging bullish to the primary bullish market condition will be started.
If D1 price will break 1.1446 resistance level on close bar from below to above so the primary bullish trend will be continuing with 1.1494 level as the nearest target in this case..
If not so the price will be on ranging within the levels.
TREND : ranging
Forum on trading, automated trading systems and testing trading strategies
Forecast for Q2'16 - levels for Hang Seng Index (HSI)
Sergey Golubev, 2016.05.23 08:30
Hang Seng Index Technical Analysis 2016, 22.05 - 29.05: bearish ranging within narrow s/r levels waiting for breakdown or breakout
Daily price is on bearish market condition located to be below Ichimoku cloud and Senkou Span line which is the virtual border between the primary bearish and the primary bullish trend on the chart. The price is ranging within narrow support/resistance levels waiting for breakdown or breakout of the price movement for direction of the trend to be established. Ascending triangle pattern was fomred by the price to be crossed to above for the secondary rally to be started, and Absolute Strength indicator is estimating the ranging condition to be continuing with possible bear market rally in the near future.
If D1 price will break 19,451 support level on close bar so the bearish trend will be continuing up to the next bearish target.
If D1 price will break 20,019 resistance level on close bar from below to above so the local uptrend as the bear market rally will be started with the good possibility to the bullish reversal in the secondary ranging way.
If not so the price will be on ranging within the levels.
SUMMARY : ranging
TREND : bearishForum on trading, automated trading systems and testing trading strategies
Forecast for Q2'16 - levels for AUD/USD
Sergey Golubev, 2016.05.23 14:27
Daily price is on breakdown with the bearish reversal:

If the price breaks 10-day low at 0.7175 to below on close daily bar so the bearish reversal of the price movement will be started.If the price breaks 10-day high at 0.7401 to above on the daily close bar so the primary bullish trend will be continuing.
If not so the price will be on the ranging condition waiting for direction.
Forum on trading, automated trading systems and testing trading strategies
Forecast for Q2'16 - levels for EUR/USD
Sergey Golubev, 2016.05.24 10:38
EUR/USD Technical Analysis - daily correction to the bearish reversal
Daily price is on secondary correction within the primary bullish trend: the price is crossing 100-day SMA to below with 1.1152 support level as a next target for the price to be reversed to the daily bearish market condition.
SUMMARY : correction
TREND : ready to the bearish reversalForum on trading, automated trading systems and testing trading strategies
Forecast for Q2'16 - levels for USD/CNH
Sergey Golubev, 2016.05.25 20:17
USD/CNH Weekly Technical Analysis - ranging bullish
Weekly price is located above SMA with period 100 (100 SMA) and SMA with the period 200 (200-SMA) for the bullish market condition with the ranging within 6.5887 resistance and 6.4563 support level. The bearish reversal of the price movement is very unlikely in 2016 because of the following:
Thus, there are 3 main scenarios for the price movement for this year for example:
SUMMARY : ranging
TREND : bullishForum on trading, automated trading systems and testing trading strategies
Press review
Sergey Golubev, 2016.05.26 10:55
Trading News Events: U.S. Durable Goods Orders (based on the article)What’s Expected:
"Why Is This Event Important:Even though Fed Chair Janet Yellen remains in no rush to implement higher borrowing-costs, we may see a greater dissent at the next quarterly meeting in June as a growing number of central bank officials see the U.S. economy approaching ‘full-employment.’"
Daily Targets
EURUSD D1
Intra-Day Targets
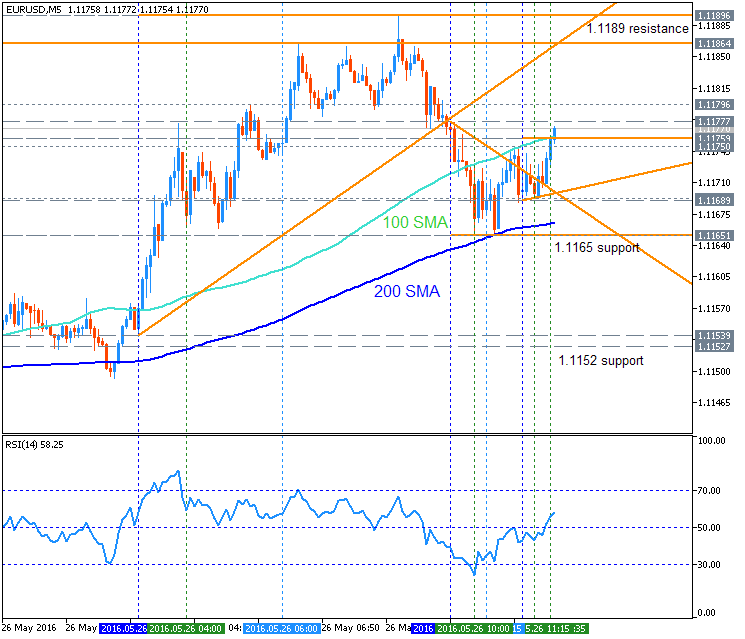
EURUSD M5
Forum on trading, automated trading systems and testing trading strategies
Press review
Sergey Golubev, 2016.05.27 07:17
Fed Chair Yellen Speaks - "We do not expect any comments on the near-term"
2016-05-27 17:15 GMT | [USD - Federal Reserve Chair Janet Yellen Speech]
Barclays:
==========
H4 price is located below SMA with the period 200 (200-SMA) for the primary bearish market condition for the ranging within 1.1216 resistance level and 1.1128 support level. Ascending triangle pattern was formed by the price to be crossed to above for the secondary rally to be started with 1.1242 level as a nearest target to re-enter. The bullish reversal level at 1.1348 located near and abvove 200 SMA, and if the price breaks this level to above so the bullish reversal of the intra-day price movement will be started.
Forum on trading, automated trading systems and testing trading strategies
Press review
Sergey Golubev, 2016.05.27 10:36
Trading News Events: U.S. Gross Domestic Product (adapted from the article)"An upward revision in the preliminary 1Q Gross Domestic Product (GDP) report may trigger near-term selloff in EUR/USD as signs of a stronger recovery provide the Federal Open Market Committee (FOMC) with greater scope to implement higher borrowing-costs."
What’s Expected:
Why Is This Event Important:
"With the U.S. economy approaching ‘full-employment,’ a faster rate of growth may encourage a greater number of Fed officials to vote for a rate-hike at the next quarterly meeting in June as the central bank sees a sustainable recovery over the policy horizon."
Intra-Day Levels
EURUSD H1
The price is located below 200 SMA for the bearish market condition - price is on ranging around 100 SMA waiting for direction of the trend:
If the price breaks 1.1174 support level on close hourly bar so the primary bearish trend will be continuing up to 1.1138 as a good target to re-enter.
If the price breaks 1.1236 resistance level on close hourly bar so the reversal of the price movement from the ranging bearish to the primary bullish trend will be started.
If not so the price will be on ranging within the levels waiting for direction.
Forum on trading, automated trading systems and testing trading strategies
Forecast for Q2'16 - levels for SILVER (XAG/USD)
Sergey Golubev, 2016.05.29 18:45
SILVER (XAG/USD) Technical Analysis 2016, 29.05 - 05.06: breaking 16.09 support level to the bearish reversal
Daily price is located near and above Senkou Span line which is the virtual border between the primary bearish and the primary bullish trend on the chart: price is testing Senkou Span together with 16.09 support level to below for the bearish reversal to be started. Absolute Strength indicator is estimating the the ranging condition to be continuing, and Chinkou Span line broke the price to below on open daily bar for the possible bearish reversal in the near future.
If D1 price will break 16.09 support level on close bar so the reversal of the price movement from the primary bullish to the primary bearish market condition will be started.
If D1 price will break 17.99 resistance level on close bar from below to above so the bullish trend will be continuing.
If not so the price will be on ranging within the levels.
SUMMARY : ranging to bearish reversal
TREND : ranging