EURUSD Technical Analysis 2016, 08.07 - 14.08: possible daily bearish breakdown with 1.1072 support level
Forum on trading, automated trading systems and testing trading strategies
Sergey Golubev, 2016.08.08 07:13
From wikipedia:
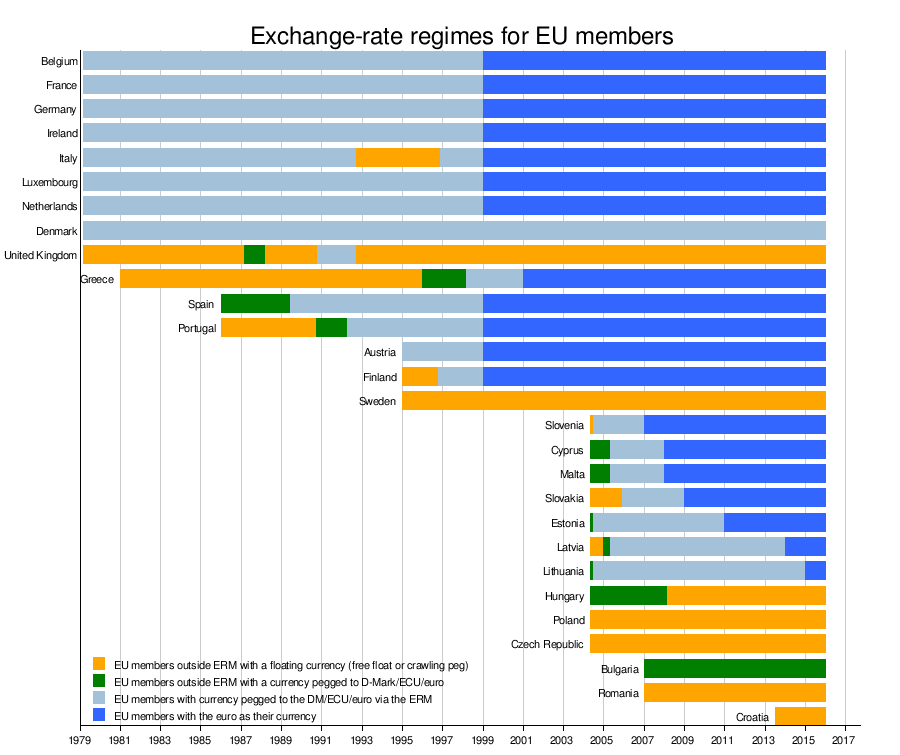
"The chart below provides a full summary of all applying exchange-rate regimes for EU members, since the European Monetary System with its Exchange Rate Mechanism and the related new common currency ECU was born on 13 March 1979. The euro replaced the ECU 1:1 at the exchange rate markets, on 1 January 1999. During 1979-1999, the D-Mark functioned as a de facto anchor for the ECU, meaning there was only a minor difference between pegging a currency against ECU and pegging it against the D-mark."
Forum on trading, automated trading systems and testing trading strategies
Sergey Golubev, 2016.08.09 14:45
Staying USD Bearish - Morgan Stanley (based on the article)
- "As long as US inflation expectations remain low, the Fed is unlikely to raise rates early."
- "Hence, the Fed is likely to stay behind the curve, suggesting US real yields coming down again. However, it is not only the Fed which makes us USD-bearish."
- if the price breaks 1.1226 resistance on close daily bar so the price will be reversed to the bullish market condition;
- if the price breaks 1.1045 support level so the primary bearish trend will be resumed;
- if not so the price will be on ranging for direction.
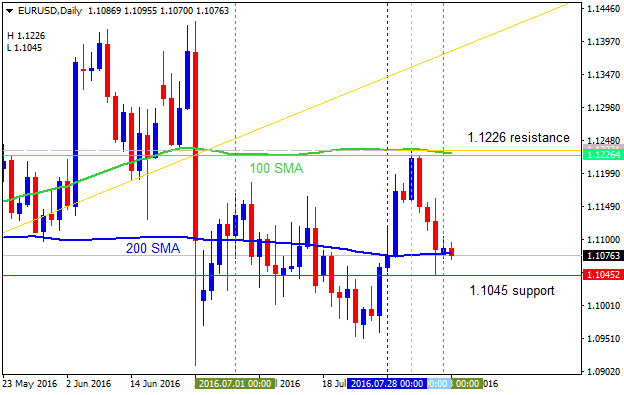
| Resistance | Support |
|---|---|
| 1.1226 | 1.1045 |
| N/A | N/A |
Daily price is located below Ichimoku cloud in the bearish
area of the chart: price was bounced from 1.1233 resistance leve to below for the bearish trend to be resumed. The support level at 1.1072 is going to be tested by the daily price to below for the bearish trend to be continuing.
Absolute Strength indicator is evaluating the bearish trend in the near future, and Trend Strength indicator is estimating the future trend as a secondary ranging. Chinkou Span line is breaking the price to below for good possible breakdown.
If D1 price breaks 1.1233 resistance level on close bar from below to above so the bullish reversal will be started on the secondary ranging way.
If not so the price will be on bearish ranging within the levels.
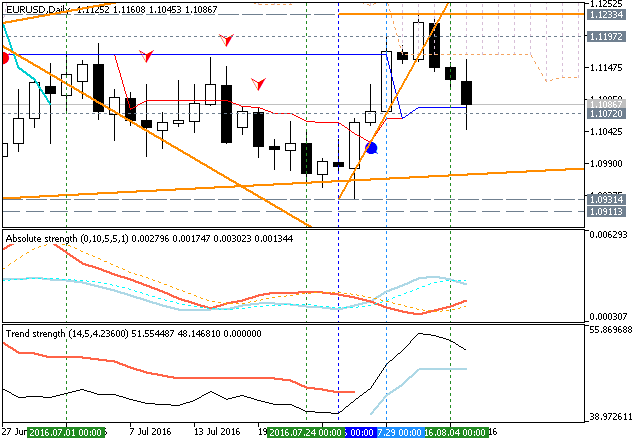
- Recommendation for long: watch close D1 price to break 1.1233 for possible buy trade
- Recommendation
to go short: watch D1 price to break 1.1072 support level for possible sell trade
- Trading Summary: bearish
| Resistance | Support |
|---|---|
| 1.1233 | 1.1072 |
| N/A | 1.0931 |
SUMMARY : ranging bearish
Daily price is still on bearish ranging with 1.1233 bullish reversal level: the price is located inside Ichimoku cloud within the following s/r levels:
- 1.1233 resistance located in the beginning of the bullish trend to be started, and
- 1.1045 support level located below Ichimoku cloud in the primary ebarish area of the chart.
Chinkou Span line crossed the price to above on open daily bar for the possible breakout in the near future, and Absolute Strength indicator is estimating the future possible trend as the secondary ranging.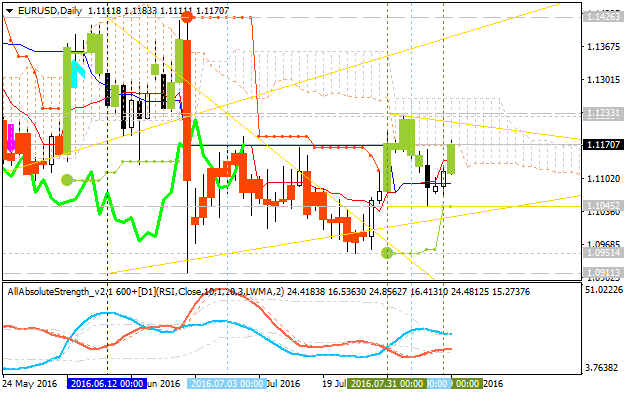
I think, the most likely scenario fo the price movement for this week except Friday is the following: ranging waiting for direction for the bearish trend to be resumed or for the daily bullish reversal.
Forum on trading, automated trading systems and testing trading strategies
Sergey Golubev, 2016.08.11 13:44
Technical Targets for EUR/USD by United Overseas Bank (based on the article)
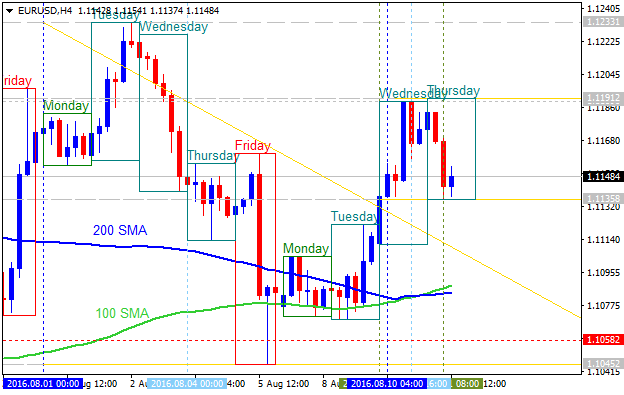
H4 price
is located above 100 SMA/200 SMA reversal area: the price is on bullish market condition for the secondary ranging within
the following key reversal support/resistance
levels:
- 1.1191 resistance level located above 100 SMA/100 SMA in the bullish trend to be continuing, and
- 1.1135 support level located in the beginning fo the secondary correction to be started.
The bearish reversal level is 1.1058 support, and if the price breaks this level to below on close H4 bar so the reversal of the intra-day price movement from the bullish to the primary bearish market condition will be started.
Daily
price. United Overseas Bank is expecting for EUR/USD to be continuing with the ranging condition with the trading within the channel of s/r levels:
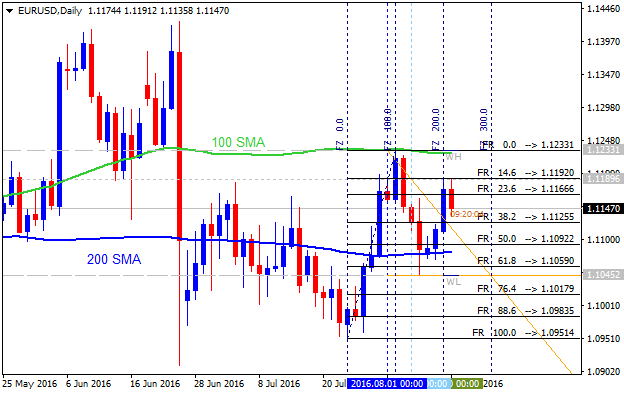
- If daily price breaks 1.1233 resistance level
on close bar so the bullish trend will be resumed.
- If daily price breaks 1.1059 support level on close bar so the primary bearish reversal will be started.
- If not so the price will be ranging within the levels.
Forum on trading, automated trading systems and testing trading strategies
Sergey Golubev, 2016.08.11 15:43
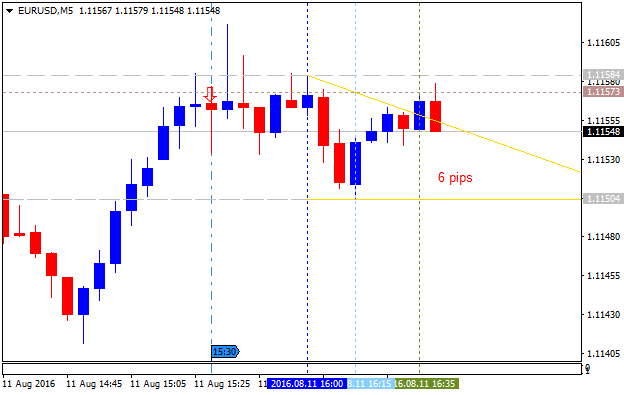
EUR/USD Intra-Day Fundamentals: U.S. Jobless Claims and 6 pips range price movement
2016-08-11 12:30 GMT | [USD - Unemployment Claims]
- past data is 267K
- forecast data is 265K
- actual data is 266K according to the latest press release
if actual < forecast (or previous one) = good for currency (for USD in our case)
[USD - Unemployment Claims] = The number of individuals who filed for unemployment insurance for the first time during the past week.
==========
From the MarketWatch article:
- "The number of people filing for unemployment benefits declined 1,000 to a seasonally adjusted 266,000 in the August 6 week, the Labor Department said Thursday."
- "Initial claims have been below the key 300,000 threshold for 75 weeks in a row, the longest such streak since 1970."
- "Economists surveyed by MarketWatch had forecast claims would total 265,000."
- "The 4-week moving average, which smooths out weekly volatility, rose 3,000 to 262,750."
- "Continuing claims rose by 14,000 and totaled 2.16 million in the most recent week."
==========
EUR/USD M5: 6 pips range price movement by U.S. Jobless Claims news event
Forum on trading, automated trading systems and testing trading strategies
Sergey Golubev, 2016.08.12 17:17
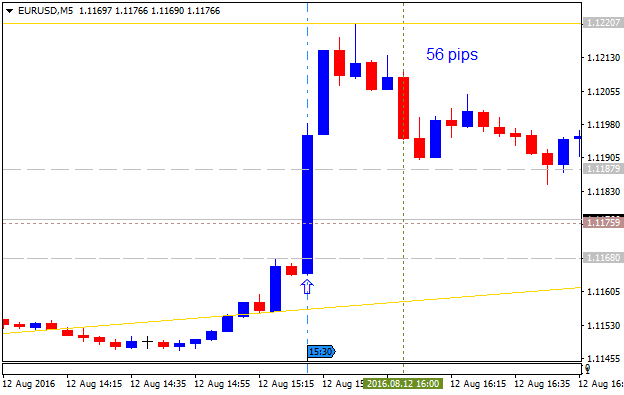
Intra-Day Fundamentals - EUR/USD, GBP/USD and AUD/USD: U.S. Advance Retail Sales
2016-08-12 12:30 GMT | [USD - Retail Sales]
- past data is 0.8%
- forecast data is 0.4%
- actual data is 0.0% according to the latest press release
if actual > forecast (or previous one) = good for currency (for USD in our case)
[USD - Retail Sales] = Change in the total value of sales at the retail level.
==========
From MarketWatch:
- "U.S. retail sales were little-changed in July, down from a gain of 0.8% in June, the Commerce Department reported.
Economists polled by MarketWatch had expected growth of 0.4% on the
month, compared with an original estimate of 0.6% growth in June. Auto
sales rose 1.1% in July, representing the strongest result since April.
But excluding autos, retail-sales growth slumped 0.3% last month—the
weakest reading since January, after a 0.9% gain in the prior month."
- "Jim O’Sullivan, chief U.S. economist at High Frequency Economics, estimated that "total-real consumption, including services, starting the third quarter up at about a 3% annual rate from the second-quarter average. The net result is still solid growth," O’Sullivan said."
- "Shepherdson said that the data fit with a 2.5% forecast for third quarter GDP, up from the 1.2% rate in the second quarter."
==========
EUR/USD M5: 56 pips price movement by U.S. Advance Retail Sales news event
- Free trading apps
- Over 8,000 signals for copying
- Economic news for exploring financial markets
You agree to website policy and terms of use
Daily price is located below Ichimoku cloud in the bearish area of the chart: price was bounced from 1.1233 resistance leve to below for the bearish trend to be resumed. The support level at 1.1072 is going to be tested by the daily price to below for the bearish trend to be continuing.
Absolute Strength indicator is evaluating the bearish trend in the near future, and Trend Strength indicator is estimating the future trend as a secondary ranging. Chinkou Span line is breaking the price to below for good possible breakdown.
If D1 price breaks 1.1072 support level on close bar so the primary bearish trend will be continuing.If D1 price breaks 1.1233 resistance level on close bar from below to above so the bullish reversal will be started on the secondary ranging way.
If not so the price will be on bearish ranging within the levels.
SUMMARY : ranging bearish
TREND : bearish