Market Condition Evaluation based on standard indicators in Metatrader 5 - page 141
You are missing trading opportunities:
- Free trading apps
- Over 8,000 signals for copying
- Economic news for exploring financial markets
Registration
Log in
You agree to website policy and terms of use
If you do not have an account, please register
Forum on trading, automated trading systems and testing trading strategies
Forecast for Q1'16 - levels for EUR/USD
Sergey Golubev, 2016.01.15 07:48
EUR/USD Intra-Day Technical Analysis - ranging near 100 SMA/200 SMA area for direction of the trend
M30 price is located near and above SMA with period 100 (100-SMA) and SMA with the period 200 (200-SMA) for th bullish ranging market codition waiting for the direction for the possible breakout or breakdown. Ascending triangle pattern was formed by the price to be crossed to above for the bullish trend to be continuing, and RSI indicator is estimating the ranging bullish condition to be in the near future for example.
SUMMARY : ranging
TREND : waiting for directionForum on trading, automated trading systems and testing trading strategies
Press review
Sergey Golubev, 2016.01.15 15:10
EUR/USD Intra-Day Fundamentals - Core Retail Sales and 64 pips price movement
2016-01-15 13:30 GMT | [USD - Core Retail Sales]
if actual > forecast (or previous one) = good for currency (for USD in our case)
[USD - Core Retail Sales] = Change in the total value of sales at the retail level, excluding automobiles.
==========
EURUSD M5: 64 pips price movement by USD - Core Retail Sales news event :
Forum on trading, automated trading systems and testing trading strategies
Press review
Sergey Golubev, 2016.01.16 09:22
What we’re watching (based on the article)
USD to Turkish Lira: bullish breakout
Weekly price was on ranging market condition to be located above Ichimoku cloud in the bullish area of the chart. The price was started with the secondary breakout within the primary bullish trend in the beginning of January this year by breaking 3.0279 resistance level: price is breaking 3.0745 resistance for the bullish breakout to be continuing, and Absolute Strength indicator is estimating the bullish trend in a medium-term and a long-term situation for this pair.
If the price will break 2.8154 support level so the reversal of the price movement from the primary bullish to the primary bearish market condition will be started with the secondary ranging: the price will be located inside Ichimoku cloud in thius case.
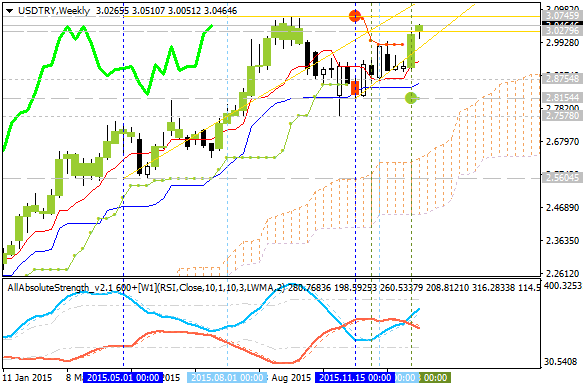
If the price will break 2.5604 support level so the price will be fully reversed to the bearish condition without ranging.
If the price will break 3.0745 resistance level from below to above so the primary bullish trend will be continuing.
If not so the price will be ranging between the levels.
Trend:
W1 - bullish breakoutForum on trading, automated trading systems and testing trading strategies
Forecast for Q1'16 - levels for EUR/USD
Sergey Golubev, 2016.01.18 10:39
Forecast for Tomorrow - levels for EUR/USD
H4 price is bullish market condition for the ranging near and above Ichimoku cloud and Senkou Span line which is the birtual border between the primary bearish and the primary bullish trend on the chart. The price is ranging within the following key reversal support/resistance levels:
Chinkou Span line is located near the price to be ready for breakout or breakdown, and Absolute Strength indicator is estimating the ranging condition in the near future.
If H4 price will break 1.0804 support level on close H4 bar so the reversal of the price movement from the primary bullish to the primary bearish market condition will be started.
If H4 price will break 1.0984 resistance level so the bullish trend will be continuing.
If not so the price will be ranging within the levels.
SUMMARY : waiting to break the levels
TREND : rangingForum on trading, automated trading systems and testing trading strategies
Forecast for Q1'16 - levels for USD/JPY
Sergey Golubev, 2016.01.18 11:30
USDJPY Technical Analysis 2016, 17.01 - 24.01: daily bearish breakdown to be continuing
Daily price was on the bearish breakdown: price crossed key support levels together with 100 day SMA/200 day SMA, and it was stopped by 116.13 support level to be started with the ranging within 116.13/119.16 ranging area.
RSI indicator is estimating the ranging bearish condition to be continuing in the near future.If D1 price will break 116.13 support level on close bar so the bearish breakdown to be continuing.
If D1 price will break 119.16 resistance level on close bar so we may see the local uptrend as the bear market rally within the primary bearish condition.
If D1 price will break 123.66 resistance level on close bar so the price will be reversed to the primary bullish trend.
If not so the price will be on ranging within the levels.
SUMMARY : bearish breakdown
TREND : daily bearishForum on trading, automated trading systems and testing trading strategies
Press review
Sergey Golubev, 2016.01.19 08:51
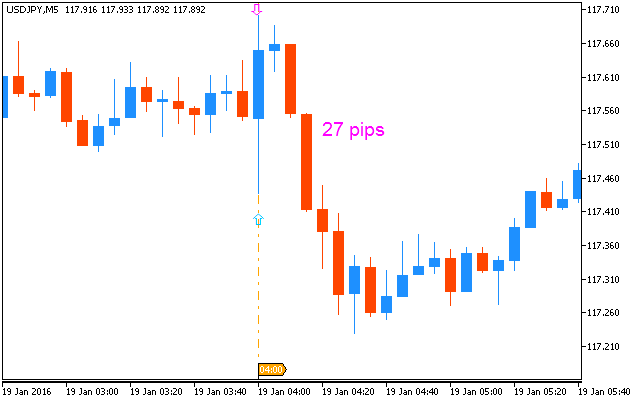
USD/JPY Intra-Day Fundamentals: China Gross Domestic Product and 27 pips range price movement
2016-01-19 02:00 GMT | [CNY - GDP]
if actual > forecast (or previous one) = good for currency (for CNY in our case)
[CNY - GDP] = Change in the inflation-adjusted value of all goods and services produced by the economy.
==========
USDJPY M5: 27 pips range price movement by CNY - GDP news event :
Forum on trading, automated trading systems and testing trading strategies
Press review
Sergey Golubev, 2016.01.19 08:43
GBP/USD Intra-Day Fundamentals: China Gross Domestic Product and 16 pips price movement
2016-01-19 02:00 GMT | [CNY - GDP]
if actual > forecast (or previous one) = good for currency (for CNY in our case)
[CNY - GDP] = Change in the inflation-adjusted value of all goods and services produced by the economy.
==========
GBPUSD M5: 16 pips price movement by CNY - GDP news event :

Forecast for Tomorrow: intra-day levels for USD/CAD, EUR/USD, USD/JPY
USD/CAD: ranging bullish. This pair is ranging to be above Ichimoku cloud within key support/resistance levels to be broken for the bullish trend to be continuing or for possible bearish reversal to be started.
EUR/USD: ranging for direction. The price for the pair is located above and near Ichimoku cloud for the bullish market condition ranging on the border between the bearish/bullish reversal area waiting for the direction of the trend.
USD/JPY: waiting for big news to start big movement. Intra-day H4 price is located inside Ichimoku cloud and near 'reversal' Senkou Span line (which is the virtual border between the primary bearish and the primary bullish trend on the chart) and with the symmetric triangle pattern which was broken by the price to above for the possible bullish trend to be started.The price is ranging within 118.10/117.00 as intermediate s/r levels and within 118.83/116.50 as the key s/r levels.
Forum on trading, automated trading systems and testing trading strategies
Press review
Sergey Golubev, 2016.01.20 08:28
NZD/USD Intra-Day Fundamentals: Consumer Price Index and 74 pips price movement
2016-01-19 02:00 GMT | [NZD - CPI]
if actual > forecast (or previous one) = good for currency (for NZD in our case)
[NZD - CPI] = Change in the price of goods and services purchased by consumers.
==========
"In the December 2015 quarter compared with the September 2015 quarter:
==========
NZDUSD M5: 74 pips price movement by NZD - CPI news event :