Indicators with alerts/signal - page 643
You are missing trading opportunities:
- Free trading apps
- Over 8,000 signals for copying
- Economic news for exploring financial markets
Registration
Log in
You agree to website policy and terms of use
If you do not have an account, please register
Hi,
I like to know if anyone can install an alert on this hama step histogram indy, so that it alerts when the bar closes below or above the 0.0001 line? thanks for your assistance in advance...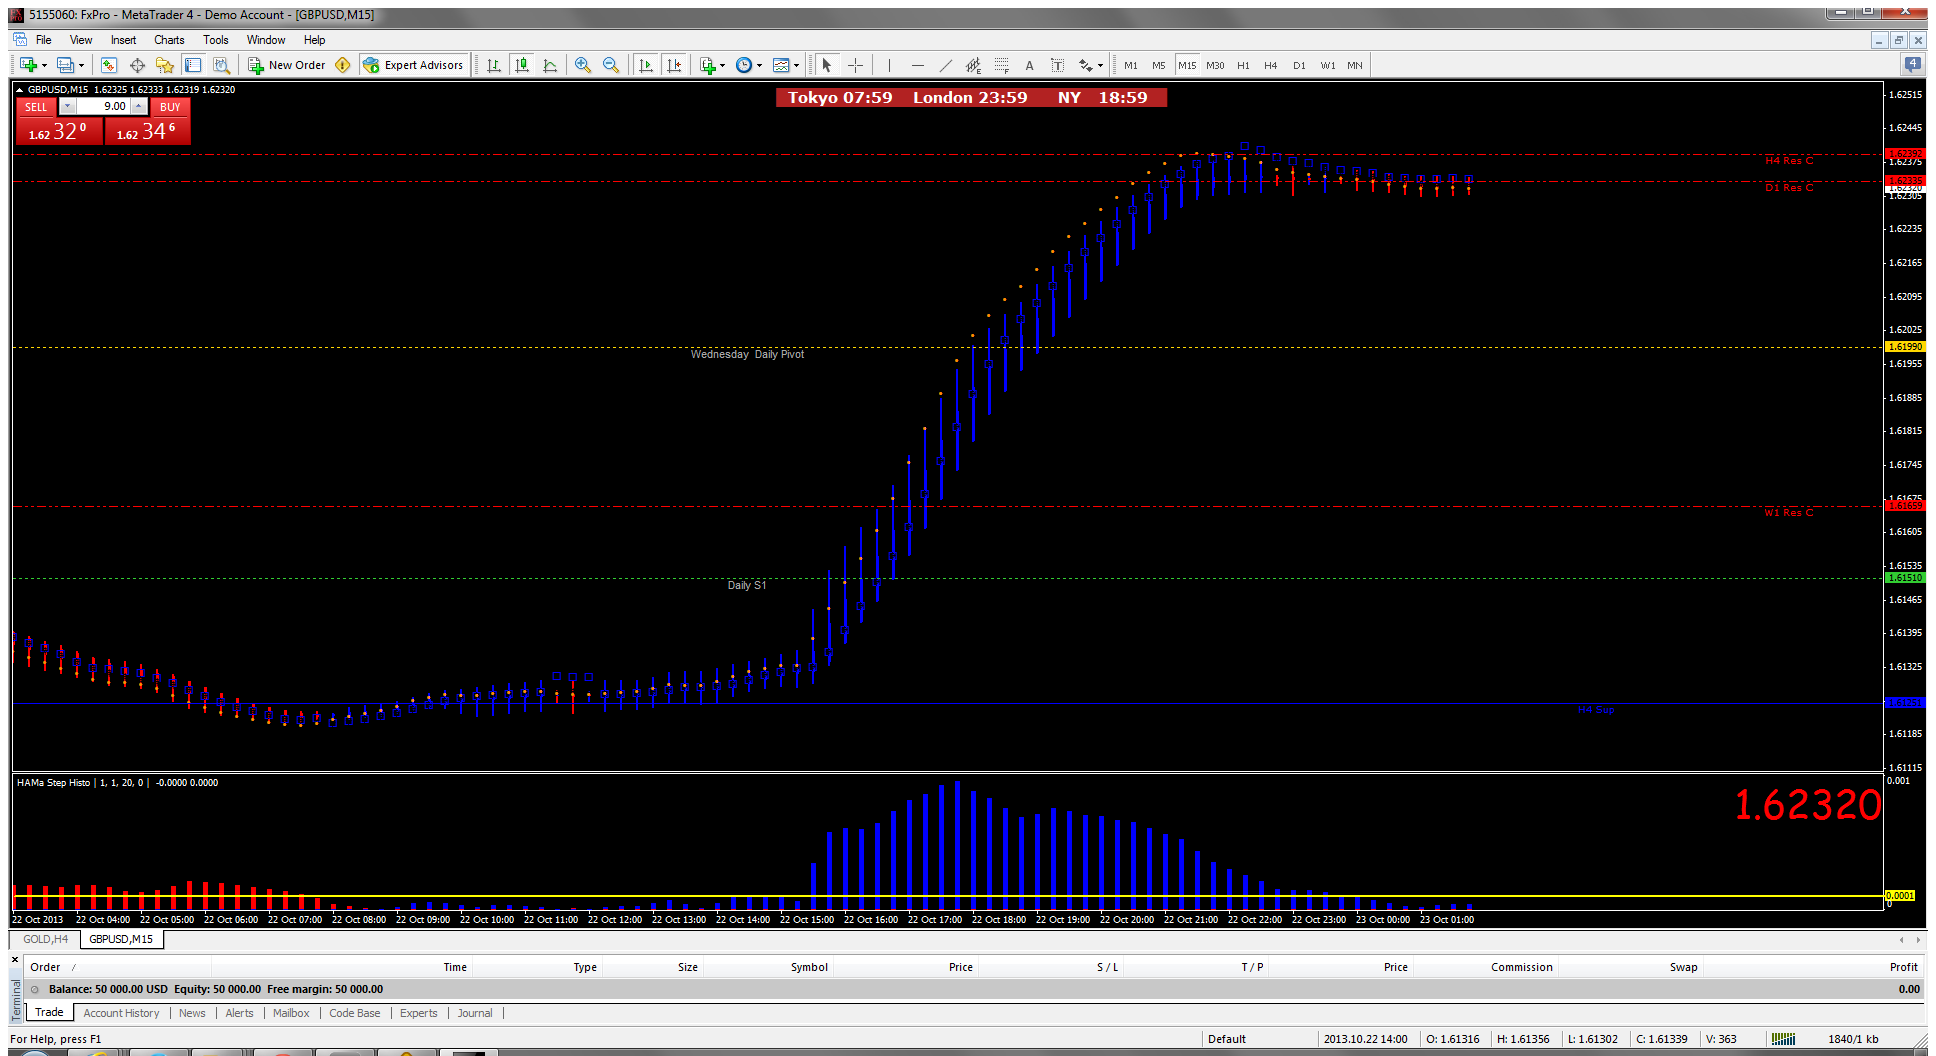
Hi, I like to know if anyone can install an alert on this hama step histogram indy, so that it alerts when the bar closes below or above the 0.0001 line? thanks for your assistance in advance...
Hi Profittrader,
Made this version that's working, know there is a better way to do this but its not coming to me now , will update once I figure it out.
Hi Mr.Tools,
I have that version...but the levels give a better entry and exit...I hope you can work it out?
Hi Mr.Tools, I have that version...but the levels give a better entry and exit...I hope you can work it out?
Levels added on that version(called it triggerLevels), just feel there was a better way of coding it and once I figure that out will update.
Hi Profittrader, Made this version that's working, know there is a better way to do this but its not coming to me now
also if you can work it out...can you also add text to show sideways (consolidation)market when the bars are below the 0.0001 line and buy or sell when the bars are above the 0.0001 line...(buy on the blue and sell on the red)...thanks again Mr.Tools
ok...Thanks
Levels added on that version(called it triggerLevels), just feel there was a better way of coding it and once I figure that out will update.
Mr.Tools it looks good so far, if you could add the text and any improvements it would be greatly appreciated...
Ricmi, added the alerts and updated the t3 somewhat.
Sorry,but after a few days I saw that is alert for crosssing RSI and blue (sentiment) line.I am looking for alert for crossing RSI and volatility lines (white lines in your picture).Thank you.
Sorry,but after a few days I saw that is alert for crosssing RSI and blue (sentiment) line.I am looking for alert for crossing RSI and volatility lines (white lines in your picture).Thank you.
Ricmi, are you looking for a sell alert when rsi crossing the top band and a buy alert when rsi crosses the bottom band or the opposite?
Ces, hopefully UV means the option for different sound wav. files
MRTools...
Noticed something today and wonder if this is an easy fix or not.
I noticed arrows that appeared on the chart when the RSI exits the Level areas that I set, but if the price pulls the RSI back into a false condition the arrow stays on the chart.
I can see that this could cause an overload of alerts if the arrow appears and dissapears as price moves RSI back and forth around the Levels.
Is there a way to get the alert and arrow the first time that RSI exits the level. Then have the arrow removed if condition becomes false and reappear as it is true again (but no subsequent alert sounds)?
I would envision alert sound ... arrow plotted... and the arrow may indeed flash on and off as condition changes... then a final 'resting point' for the arrow after candle closes.
I hope this is possible and makes sense.
Thanks agian