Price Patterns(Gartley,Butterfly,Bat,...) - page 118
You are missing trading opportunities:
- Free trading apps
- Over 8,000 signals for copying
- Economic news for exploring financial markets
Registration
Log in
You agree to website policy and terms of use
If you do not have an account, please register
And the same interesting situation for patterns (HWAFM patterns tool for Metatrader 5). We are having future possible bullish for this pair for all developing patterns for timeframes started from H1 till D1:
Anyway - I placed those 2 pending orders (buy stop and sell stop - see image from the previous post) so we will see ...And it is just a continuation of the post #1158, 1159 and 1162.
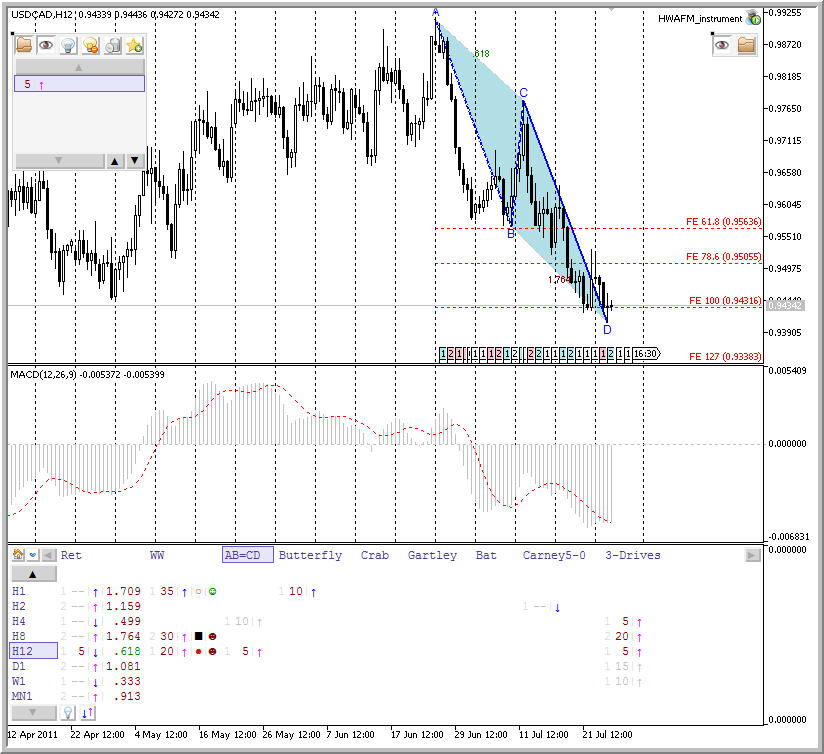
USDCAD:
It is 20 pips in profiot for now.
=============
- HWAFM tool for Metatrader 5 is here;
- How to instal - read started from this page till this one
- How to instal HWAFM tool for Metatrader 5 for Windows 7 : read this page till this one.
- Trend Scalp system for M1 timeframe for Metatrader 4 to be used together with HWAFM tool for Metatrader 5: public version and elite section version.
- how to trade using HWAFM patterns tool for Metatrader 5 and Trend Scalp system for M1 timeframe for Metatrader 4 in the same time :some trading examples/trading statements/results started from this page till this one; explanation about trading styles - read this post; explanation about Maksigen indicator - read this post.
- semi-automatic method of trading by EA: idea originally came from this page till this page; Original version for semi-automatic trading is 10p3v0.0321 EA; The new version for semi-automatic trading is 10p3v0.0331 EA: download from this post with the explanation - the user can select between MACD or TrandScalp strategies.; 10p3v0.0321_1 EA to be used together with Trend Scalp system for M1 public version with no re-enters is on this post and same but improved version (10p3v0.0321_2) with re-enters is on this post (use/download 2 indicators from previous 10p3v0.0321_1 version/post); explanation of the EA's inpuit is here.
ND, in the daily chart I have a three buy signals, at the bottom of channel the red dot, mouteki signals buy and bigbears arrow. On the 1hr my buy signals are butterfly bullish, mouteki with next up target at .8069 and the Makisgen blue dotted line target at .8114 area. So in using Makisignal on the 1hr this is the intended target this blue dotted line, correct, just checking the obvious.
Some more about this Maksigen indicator.
This is USDJPY, M1 timeframe. So, we can see this blue dotted line at 77.94 (last resistance line, possible buy stop level). It was some minutes ago:
This breakout was happened (seems - take profit ) and it is the situation for now (see those red/blue lines):

When all (yellow, abnd blue/red lines) are very close to the price and to each other - it means that we will have breakout/breakdown soon.Ah..I'm with you. So the recommendation is to use Maki just for scalping on the m1/m5 and perhaps the 15m t/f.
Blue Maksigen line is indicating that if the price will cross this line so it may be breakout. This line is breakout level (possible breakout, as price may cross/touch this line 2 time before real breakout). Anyway - I am using this level for placing buy stop order. If this line will be disappeared so I will delete this pending order, or I will move it to the next level related to new location of this blue line).
As to arrow ... I see that this arrow is on open bar, right? if on open bar so ... we can understand this arrow as warning signal ... something as "possible buy may be soon".
But this Maksigen blue line for H1 hour may be different for D1 ...
But breakout is breakout for any timeframe - just take profit and stop loss levels may be different ... and time to enter (on close bar) may be different. I mean: we need to wait 1 minutes for the bar to be closed for M1 timeframe ... and we need to wait 1 day for D1 timeframe for the bar to be closed.
That is why people are using M5 or M15 to trade breakout.
-----------
targus,
Use chart shift - press this button:
otherwise it will be difficult for you to trade ... because Ichimoku indicator is drawing the lines to the future (some forecasting), patterns are having some lines, maksigen indicator is drawing the lines and you can not see them.
Ah..I'm with you. So the recommendation is to use Maki just for scalping on the m1/m5 and perhaps the 15m t/f.
Yes. And for more highier timeframes - just for support/resistance lines, or together with some other indicators (I am using together with Ichimoku) ... or to write some articles to newspaper something as
"if the price will cross this ... resistance line to bullish so we will have ... first profit level ... second profit level ... stop loss level ... but if this price will cross ..."
Pressed the shift, I can see on the 4hr blue/red dotted lines close together, blue at .8037 and red at .8025, yes very close as you describe, well mouteki is on a buy and we have the bullish patterns, so will see.
On the example scalp that you gave on usd/jpy 1m t/f.. from 77.96 to 78.16 is your take profit when at that yellow line?
Here is the 4hr chart I was referring to where red/blue are close together.
may be - those red/blue are from lower timeframe ... you did not wait for H4 chart to be moved by ticks, or for bar to be closed ... just change the timeframes many times and you will see.
Those blue/red are not appeared immediately ... we should keep the chart opened and wait.
Yes, bar close. So, with bar close, the tendancy being next new bar will carry on in that direction on that given timeframe when it is ready to do so if no bar close in the up direction beyond the blue dotted line then price will simply go back down and so on. When it is ready for up in this case in line with the daily, we must wait for bar close on the 4hr above the blue line etc. same applies in all timeframes.
...On the example scalp that you gave on usd/jpy 1m t/f.. from 77.96 to 78.16 is your take profit when at that yellow line?
It was blue line (near yellow line).
Not, I did not trade USDJPY manually today: I am using 10p3v0.0321_2 EA on this pair.