You are missing trading opportunities:
- Free trading apps
- Over 8,000 signals for copying
- Economic news for exploring financial markets
Registration
Log in
You agree to website policy and terms of use
If you do not have an account, please register
AUD/USD Intra-Day Fundamentals: RBA Monetary Policy Meeting Minutes and 23 pips price movement
2016-06-21 01:30 GMT | [AUD - Monetary Policy Meeting Minutes]
[AUD - Monetary Policy Meeting Minutes] = Detailed record of the RBA Reserve Bank Board's most recent meeting, providing in-depth insights into the economic conditions that influenced their decision on where to set interest rates.
==========
The members of the Reserve Bank of Australia's monetary policy board said that low inflation allowed them to keep the nation's benchmark lending rate steady at a record low.==========
AUD/USD M5: 23 pips price movement by RBA Monetary Policy Meeting Minutes news event
EUR/USD: Targets on Brexit or Bremain (adapted from the article)
Brexit
"EUR to quickly follow GBP lower on Brexit: we believe that a sharp fall in GBP under Brexit could quickly spill-over to a similar-sized sell-off in EUR/USD and which could see parity tested within days of a Brexit referendum outcome."
Bremain
"Dual EUR/USD upside from ‘Remain’ but still a range trade: under our continued, albeit not high-conviction, assumption that the UK elects to say in the EU, global risk sentiment will undoubtedly improve. We would judge that EUR/USD should recoup part of the ground lost since early May when EUR/USD briefly traded above 1.16."
Daily price is located above 200 SMA and near-above 100 SMA in the primary bullish area of the chart: the price is on ranging within the following key s/r levels:
If the price breaks 1.1097 support level to below on daily close bar so the reversal of the price movement from the primary bullish to the primary bearish market condition will be started.
If the price breaks 1.1414 resistance level to above on daily close bar so the primary bullish trend will be continuing up to 1.1615 level as a possible bullish target.
If not so the price will be on bullish rabnging within the levels.
DAX Index Technical Analysis: daily breakout with possible bullish reversal (based on the article)
-----
Daily price was on breakdown for Ichimoku cloud to be crossed to below for the bearish reversal. For now, the price was bounced from 9,420.0 support level to above for the breakout with the Ichimoku cloud to be crossed to above for the price to be reversed back to the bullish market condition.
If D1 price will break 10,213.5 resistance level on close daily bar from below to above so the bullish trend will be continuing.
If not so the price will be on bearish ranging within the levels.
SUMMARY : breakout
TREND : possible bullish reversalEUR/USD Intra-Day Fundamentals: Fed Chair Yellen Testifies and 34 pips price movement
2016-06-21 14:00 GMT | [USD - Fed Chair Yellen Testifies]
[USD - Fed Chair Yellen Testifies] = Testify on the Semiannual Monetary Policy Report before the Senate Banking Committee, in Washington DC.
==========
The Washington Post:"Yellen is scheduled to testify before the Senate Banking Committee on Tuesday morning. In prepared remarks, she acknowledged that hiring has dropped off sharply in recent months but also pointed to early signs that wages are beginning to rise after years of stagnation. She said she is “optimistic” that the progress in employment will continue."
"The Fed is responsible for charting the course for the nation’s economy, with the dual mission to keep prices stable and strengthen employment. It does that by adjusting the influential federal funds rate. A higher rate helps curb inflation by making borrowing money more expensive, which discourages spending and investment and reins in economic growth. A lower rate means that money is cheap, stimulating purchases by households and businesses. That helps boost employment and speeds up the economy."
"Because rates are already so low, the Fed has limited room to reduce them further if the economy were to weaken, she said. Moving gradually also gives the central bank time to assess whether its forecast of continued economic improvement will come true."
==========
EUR/USD M5: 34 pips price movement by Fed Chair Yellen Testifies news event
Forum on trading, automated trading systems and testing trading strategies
Press review
Sergey Golubev, 2013.07.31 18:54
The Basics of Forex Leveraging :
Leverage in trading simply refers to the ability to increase the size of your trade or investment by using credit from a broker. When trading using leverage, you are effectively borrowing from your broker, while the funds in your account act as collateral. This collateral is referred to as margin.
The amount of leverage available is based on the margin requirement of the broker. Margin requirement is usually shown as a percentage, while leverage is expressed as a ratio. For example, a broker might require a minimum margin level of 2%. This means that the customer must have at least 2% of the total value of an intended trade available in cash before opening the position. A 2% margin requirement is equivalent to a 50:1 leverage ratio. In practical terms, using 50:1 leverage, having $1,000 in your account would allow you to trade up to $50,000 worth of a given financial instrument. At a 50:1 leverage, a 2% loss in the instrument traded completely wipes out a fully leveraged account. Conversely, a 2% gain doubles the account.
Leverage by Market and Instrument
Leverage available differs substantially depending on what market you are trading and from which country you are based. For example, the degree of leverage available for trading stocks is relatively low. In the United States, investors typically have access to 2:1 leverage for trading equities, a margin level of 50%.
The futures market offers much higher degrees of leverage, such as 25:1 or 30:1, depending on the contract traded.
The leverage available in the forex market is higher still at 50:1 in the U.S. and as high as 400:1 offered by brokers internationally.
Leverage in Forex Trading
High leverage availability, coupled with a relatively low minimum balance to open an account, has added to the allure of the forex market to retail traders. However, excessive use of leverage is often and correctly cited as the primary reason for traders blowing out their accounts.
The danger that extreme leverage poses to investors has been recognized and acted on by the U.S. regulatory bodies, which have created restrictions on the amount of leverage available in forex trading. In August 2010, the Commodity Futures Trading Commission (CFTC) released final rules for retail foreign exchange transactions, limiting leverage available to retail forex traders to 50:1 on major currency pairs and 20:1 for all others.
As of 2013, brokers outside the U.S. continue to offer leverage of 400:1 and higher.
Examples of Leveraged Trades in the Forex Market
In our first example, we'll assume the use of 100:1 leverage
In this case, to trade a standard $100K lot you would need to have margin of $1K in your account. If, for example, you make a trade to buy 1 standard lot of USD/CAD at 1.0310 and price moves up 1% (103 pips) to 1.0413, you would see a 100% increase in your account. Conversely, a 1% drop with a standard 100K lot would cause a 100% loss in your account.
Next, let's assume you are trading with 50:1 leverage and 1 standard $100K lot. This would require you to have margin of $2K (2% of 100K).
In this case, if you buy 1 standard lot of USD/CAD at 1.0310 and price moves up 1% to 1.0413, you would see a 50% increase in your account, while a 1% drop with a standard 100K lot would equal a 50% loss in your account.
Consider here that 1% moves are not uncommon and can even happen in a matter of minutes, especially after major economic releases. It could only take one or two losing trades using the leverage described in the examples above to wipe out an account. While it's exciting to entertain the possibility of a 50% or 100% increase in your account in a single trade, the odds of success over time using this degree of leverage are extremely slim. Successful professional traders often suffer a string of multiple losing trades but are able to continue trading because they are properly capitalized and not overleveraged.
Let's now assume a lower leverage of 5:1. To trade a standard $100K lot at this leverage would require margin of $20K. An adverse 1% move in the market in this case would cause a far more manageable 5% loss.
Fortunately, micro lots enable traders to use lower leverage levels such as 5:1 with smaller accounts. A micro lot is equivalent to a contract for 1,000 units of the base currency. Micro lots allow flexibility and create a good opportunity for beginning traders, or traders starting with smaller account balances, to trade with lower leverage.
Margin Calls
When you enter a trade, your broker will keep track of your account's Net Asset Value (NAV). If the market moves against you and your account value falls below the minimum maintenance margin, you may receive a margin call. In such an event, you could receive a request to add funds to your account, or your positions could simply be flattened automatically by the broker to prevent further losses.
The Use of Leverage and Money Management
The use of extreme leverage is fundamentally antithetical to the conventional wisdom on money management in trading.
Among the widely accepted tenets on money management are to keep leverage levels low, to use stops and to never risk more than 1-2% of your account on any one trade
The Bottom Line
Data disclosed by the largest foreign-exchange brokerages as part of the Dodd-Frank financial reform legislation has shown that a majority of retail customers lose money trading. A substantial if not leading cause is the misuse of leverage.
However, leverage has key benefits, providing the trader with greater flexibility and capital efficiency. The absence of commissions, tight spreads and available leverage are certainly beneficial to active forex traders, creating trading opportunities not available in other markets.
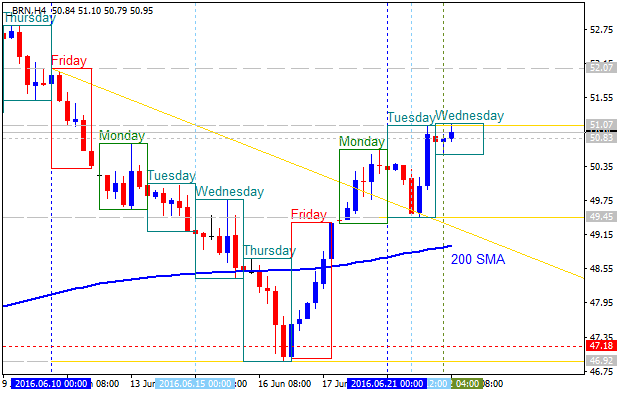
Crude Oil Price Trades Higher for 3rd Consecutive Session (adapted from the article)
Crude Oil price is on trading higher for the 4th day: intra-day H4 price was started with breakout by 200 SMA crossing to above for the intra-day bullish market condition.

If the price breaks 51.07 resistance level on close H4 bar so the primary bullish trend will be continuing on H4 timeframe.
If the price breaks 49.45 support level to below on close bar so the intra-day bearish trend will be resumed.
If not so the price will be on ranging within the levels.
Trading News Events: Canada Retail Sales (adapted from the article)
H4 price is on ranging below 200 SMA on the bearish area of the chart within the narrow support/resistance level such as the following:
Ascending triangle pattern was formed by the price to be crossed for the local uptrend as the secondary rally to be started in the near future.
SUMMARY : ranging
TREND : bearish
USD/CAD Intra-Day Fundamentals: Canada Retail Sales and 34 pips price movement
2016-06-22 12:30 GMT | [CAD - Retail Sales]
if actual > forecast (or previous one) = good for currency (for CAD in our case)
[CAD - Retail Sales] = Change in the total value of sales at the retail level.
==========
==========
USD/CAD M5: 34 pips price movement by Canada Retail Sales news event
==========
USD/CAD M5: the price is on bearish breakdown by breaking key support levels together with descending triangle pattern to below for the intra-day bearish trend to be continuing.
If the price breaks 1.2741 support level to below on close M5 bar so the bearish breakdown will be continuing, otherwise - ranging bearish.
EUR/USD Intra-Day Fundamentals: Fed Chair Yellen Testifies and 23 pips price movement
2016-06-22 14:00 GMT | [USD - Fed Chair Yellen Testifies]
[USD - Fed Chair Yellen Testifies] = Testify on the Semiannual Monetary Policy Report before the House Financial Services Committee, in Washington DC.
==========
From barchart article review:==========
EUR/USD M5: 23 pips price movement by Fed Chair Yellen Testifies news event
U.S. Commercial Crude Oil Inventories news event: bullish ranging above bearish reversal
2016-05-25 14:30 GMT | [USD - Crude Oil Inventories]
[USD - Crude Oil Inventories] = Change in the number of barrels of crude oil held in inventory by commercial firms during the past week.
==========
"U.S. commercial crude oil inventories (excluding those in the Strategic Petroleum Reserve) decreased by 0.9 million barrels from the previous week."
==========
Crude Oil M5: intra-day bearish breakdown. The price is on ranging to be above 200 period SMA within 49.65 resistance and 49.14 support levels.If the price breaks 51.05 resistance level so the reversal of the M5 price movement from the primary bearish to the primary bullish market condition will be started.
If the price breaks 50.35 support so the intra-day primary bearish trend will be continuing.
If not so the price will be on ranging within the levels.
==========
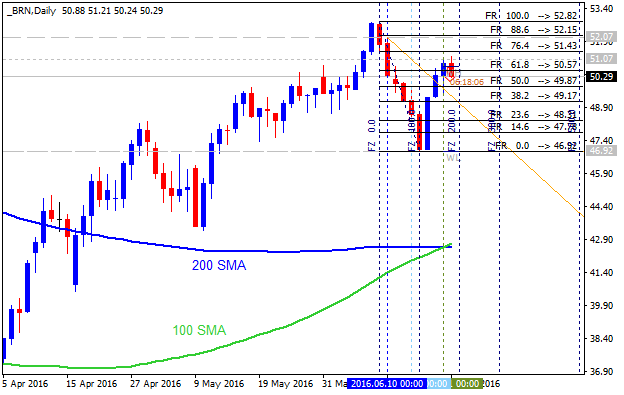
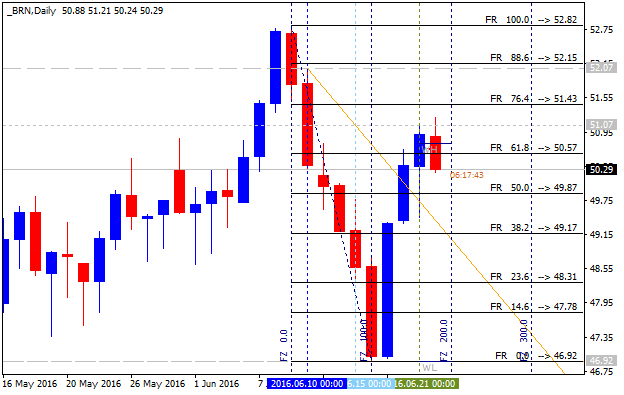
Crude Oil Daily: bullish ranging within key narrow levels. The price is located to be above 100 SMA/200 SMA reversal area in the bullish market condition: price is on ranging within 52.82 resistance level and 46.92 support level.


If the price breaks 52.82 resistance on close daily bar so the primary bullish trend will be continuing.
if the price breaks 46.92 support level on close daily bar so the local downtrend as a secondary correction within the primary bullish trend will be started.
If not so the price will be on bullish ranging within the levels.