Press review - page 543


Harmonic Trading – Different Gartley Methods (based on the article)

"The beauty of the original Gartley pattern comes from the money management system involved. Money management with Gartley allows for hefty 1:3, 1:4 or even more as risk-reward ratios. If you want a Fibonacci and Gartley approach, look for no swing above 61.8% of the previous move lower. The series of lower highs overwhelms. Bulls look trapped. Gartley labeled this segment A-B. The longest in the pattern. And then, suddenly, bulls catch a bid. This is the B-C segment. How do we know this bounce matters? The answer comes from the A-B characteristics: the lower highs series gets broken by the B-C segment."


"Larry Pesavento took Gartley’s original work to a new level. Because of him, the Gartley 222 pattern became a well-known harmonic pattern today. The “Gartley 222” method as described by Pesavento derives its name from the page no. 222 from the original Harold’s Gartley’s book. The most simplistic representation of the Gartley 222 pattern looks like this" :


"Carney was a student of Pesavento. He didn’t like to leave to many possibilities for the retracement levels, so he worked on finding a better approach. Carney’s approach to harmonic trading was made public at the turn of the century. His approach uses specific Fibonacci ratios between the Pesavento’s Gartley 222 pattern."


"Traders need to know that harmonic patterns work best with a sound money management system. Before defining the target, one must deal with the potential loss."

Harmonic Trading – Different Gartley Methods Unveiled
  • 2017.06.30
  • Colibri Trader
  • www.fxstreet.com
Harmonic trading… let’s start from the beginning. H.M. Gartley was a prominent technical analysis that looked into specific retracement patterns. One of them bears his name to this day: the Gartley trading pattern. In time, the original Gartley pattern suffered some changes. Technical analysis as we know it changed and will continue to change...
 

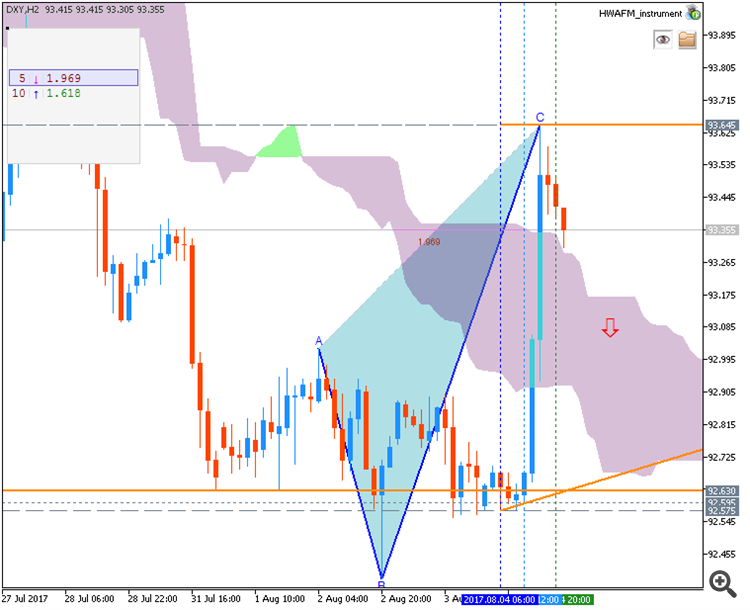
AUD/USD Intra-Day Fundamentals: Australian Retail Sales and range price movement 

2017-08-04 02:30 GMT | [AUD - Retail Sales]

  • past data is 0.6%
  • forecast data is 0.2%
  • actual data is 0.3% according to the latest press release

if actual > forecast (or previous one) = good for currency (for AUD in our case)

[AUD - Retail Sales] = Change in the total value of sales at the retail level. 

==========

From official report :

  • "The trend estimate rose 0.4% in June 2017. This follows a rise of 0.4% in May 2017 and a rise of 0.4% in April 2017.""The seasonally adjusted estimate rose 0.3% in June 2017. This follows a rise of 0.6% in May 2017 and a rise of 1.0% in April 2017."

==========

AUD/USD M5: range price movement by Australian Retail Sales news event 

8501.0 - Retail Trade, Australia, Jun 2017
  • www.abs.gov.au
JUNE KEY FIGURES JUNE KEY POINTS CURRENT PRICES The trend estimate rose 0.4% in June 2017. This follows a rise of 0.4% in May 2017 and a rise of 0.4% in April 2017. The seasonally adjusted estimate rose 0.3% in June 2017. This follows a rise of 0.6% in May 2017 and a rise of 1.0% in April 2017. In trend terms, Australian turnover rose...
 

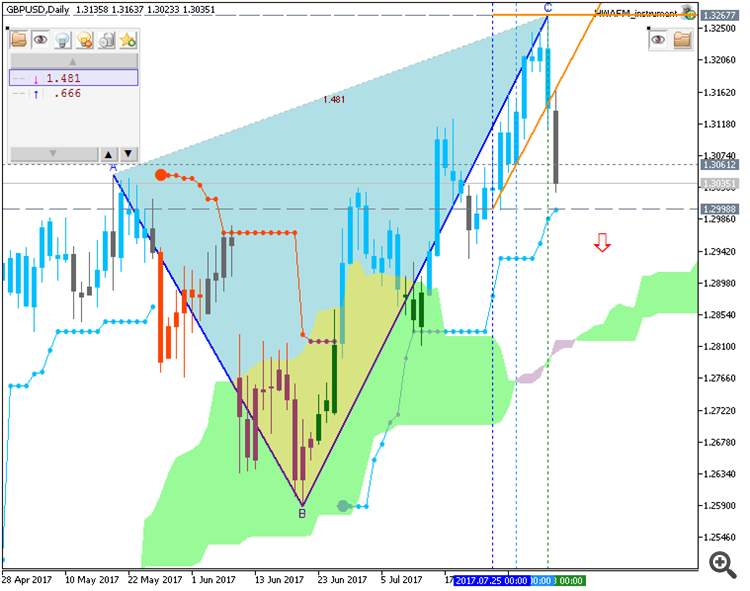
GBP/USD - daily ranging bullish; 1.3267 and 1.2817 are the keys (based on the article)

Daily price is located above Ichimoku cloud in the bullish area of the chart: the price was bounced from 1.3267 resistance level to below for the ranging to be started with 1.2817 Senkou Span line as the border between the primary bearish and the primary bullish trend on the chart.


  • "Those three votes for a rate hike were the most since 2011 at the MPC, and this triggered fresh fears of the BoE’s massive stimulus program wreaking dire consequences on the British economy. After the ‘sharp repricing’ in the value of GBP around Brexit and then the ensuing dovish campaign from the BoE, higher levels of inflation seemed simply mathematical as importers moved prices-higher to adjust for the -20% move-lower in GBP/USD."
  • "As those levels of inflation began to creep-higher earlier in the year, the thought that the BoE may need to adjust rates to stem those inflationary forces began to gain steam. In March, Kristin Forbes became the first vote for a rate hike at the BoE since Brexit, and she even accompanied that vote with an op-ed in The Telegraph to explain the rationale behind her decision. Then in June, inflation for the month of May came in at 2.9%; followed by those three dissenting votes that helped to bring some life in GBP/USD. When Mark Carney himself opined on the matter towards the end of the month, saying that rate hikes may be on the horizon for the U.K., the British Pound shot-higher to trade through the 1.3000 level."
  • "After a pullback was seen through the first two weeks of July, USD-weakness began to take over, and GBP/USD went into resumption of the bullish move after a 50% retracement, extending all the way up to fresh 2017 highs at 1.3269."

GBP/USD Technical Analysis: BoE Brings on Fibonacci Support Test
  • DailyFX
  • www.dailyfx.com
, we looked at the British Pound after the pair traded above the vaulted 1.3000 level to set a fresh 2017 high. Over the previous month, there had been starts and stops for the bullish move in the pair, and that seemingly started in June shortly after the Bank of England had surprised markets with three votes dissenting in favor of rate hikes...
 

Weekly Outlook: 2017, August 06 - August 13 (based on the article)

The US dollar remained on the back foot throughout most of the week, with the jobs report allowing for a comeback. Is this a temporary correction or the start of a dollar rally? The upcoming week features US inflation figures, the JOLTs data, a rate decision in New Zealand and more.


    1. Neel Kashkari talks: Monday 15:25 and also Friday at 15:30. The President of the Minnesota Fed is an outspoken dove that dissented from the previous rate hikes.
    2. US JOLTS Job Openings: Tuesday, 14:00. A small gain is on the cards now. A similar level of 566K is expected now
    3. Chinese inflation figures: Wednesday, 2:00. The recent rises imply higher inflation in other countries, especially in the US.
    4. US Unit Labor Costs: Wednesday, 12:30. 
    5. Crude Oil Inventories:  Wednesday, 14:30.
    6. New Zealand rate decision: Wednesday, 21:00.
    7. US PPI: Thursday, 12:30. Small gains are expected now as well1% on the headline and 0.2% on the core.
    8. US jobless claims: Thursday, 12:30. A small rise f240K to 244K is estimated.
    9. Bill Dudley talks: Thursday, 14:00. The President of the New York Fed is considered No.3 at the powerful institution. He is relatively close to the views of Fed Chair Janet Yellen and his response to the jobs report, including wages, will be of importance.
    10. US CPI: Friday, 12:30. For the month of July, both measures are expected to rise by 0.2%.
    11. Robert Kaplan talks: The President of the Dallas Fed has previously expressed worries about inflation. In his public appearance, he will have the chance to respond the latest inflation report and perhaps provide hints about the next moves by the Fed.
    Forex Weekly Outlook - August 7-11 2017 | Forex Crunch
    Forex Weekly Outlook - August 7-11 2017 | Forex Crunch
    • 2017.08.04
    • Yohay Elam
    • www.forexcrunch.com
    The US dollar remained on the back foot throughout most of the week, with the jobs report allowing for a comeback. Is this a temporary correction or the start of a dollar rally? The upcoming week features US inflation figures, the JOLTs data, a rate decision in New Zealand and more. Here are the highlights for the upcoming week. The US dollar...
     

    Weekly GBP/USD Outlook: 2017, August 06 - August 13 (based on the article)

    GBP/USD made another move tot he upside but was forced to retreat on the BOE’s bearishness. Will it remain the loser? The upcoming week features a mix of figures from all sectors.


    1. Halifax HPI: Monday, 7:30. A rise of 0.3% is on the cards.
    2. BRC Retail Sales Monitor: Monday, 23:01.
    3. RICS House Price Balance: Wednesday, 23:01. The Royal Institution of Chartered Surveyors monitors the balance between areas enjoying price increases with those showing decreases. After long months in positive double digits, the most recent report for June showed a sharp drop to 7%. A small increase to 9% is predicted.
    4. Manufacturing Production: Thursday, 8:30.
    5. Goods Trade Balance: Thursday, 8:30. Britain has a wide trade deficit that is weighing on the pound. This deficit stood at 11.9 billion pounds in May and may squeeze now. A narrower deficit of 11 billion is estimated.
    6. Construction Output:  Thursday, 8:30.
    7. NIESR GDP Estimate: Thursday, 12:00. The National Institute of Economic and Social Research is a highly regarded Think-Tank. Most recently, they published upbeat assessments about the economy. looking to the second half of 2017. However, month over month, they have shown slow growth for the three months ending in June, 0.3%, in line with official numbers that were published later on.
    GBP/USD Forecast August 7-11 2017 | Forex Crunch
    GBP/USD Forecast August 7-11 2017 | Forex Crunch
    • 2017.08.04
    • Yohay Elam
    • www.forexcrunch.com
    GBP/USD made another move tot he upside but was forced to retreat on the BOE’s bearishness. Will it remain the loser? The upcoming week features a mix of figures from all sectors. Here are the key events and an updated technical analysis for GBP/USD. Updates: GBP/USD daily chart with resistance and support lines on it. Click to enlarge...
     

    EUR/USD - intra-day correction to the bearish reversal; 1.1727 is the key (based on the article)

    Intra-day H4 price was bounced from 1.1892 resistance level to below for the secondary correction inside the primary bullish trend to be started. The price is testing 1.1727 support level together with Ichimoku cloud to below to be reversed to the primary bearish market condition.


    • "Last week, EURUSD started out on a strong note by briefly pushing through the 2010 low at 11876 on two different days, but each day it was unable to sustain above. Leading into the U.S. jobs report on Friday the euro was putting in a rising wedge on the 4-hr timeframe which provided a warning that we could soon see a downdraft if the underside of the pattern was broken. The all-around solid jobs report gave the US dollar a shot in the arm across the board. Not only was the bearish rising wedge triggered, but for the first time since June we saw a lower-low develop on the 4-hr. This puts us on alert for a bearish sequence to begin developing marked by a failure to rally and develop a lower high and then subsequent lower lows. The first area to look for the euro to struggle is roughly where it closed the week near the vicinity of 11775/800, and even if it can rise above this first level of resistance if the trend is to turn lower it shouldn’t be able to gain traction above 11850."

    EURUSD - Sellers Finally Surface, Weekly Reversal Shifts Focus Lower
    EURUSD - Sellers Finally Surface, Weekly Reversal Shifts Focus Lower
    • DailyFX
    • www.dailyfx.com
    Last week, EURUSD started out on a strong note by briefly pushing through the 2010 low at 11876 on two different days, but each day it was unable to sustain above. Leading into the U.S. jobs report on Friday the euro was putting in a rising wedge on the 4-hr timeframe which provided a warning that we could soon see a downdraft if the underside...
     

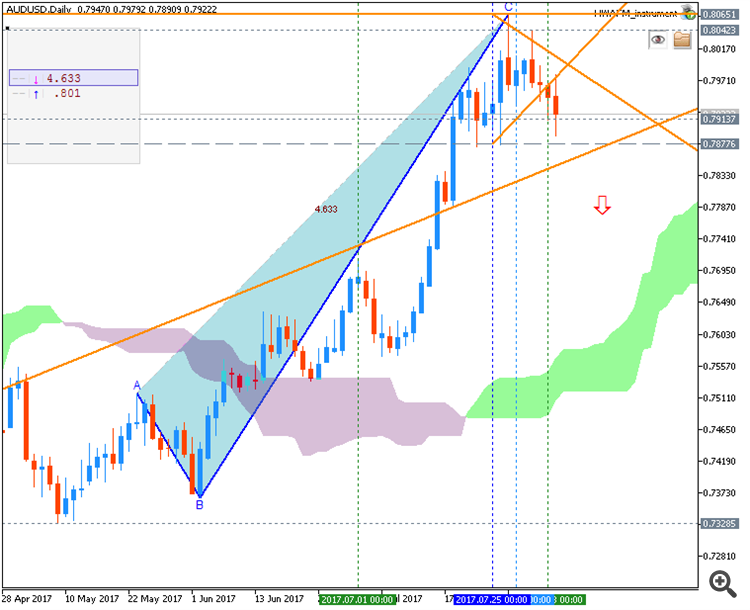
    Weekly AUD/USD Outlook: 2017, August 06 - August 13 (based on the article)

    The Australian dollar struggled with the highs but did not give up on these levels, despite RBA pressure. Where next? The upcoming week features speeches from central bankers as well as important surveys.


    1. AIG Construction Index: Sunday, 23:30. This 200-strong survey by the Australian Industry Group has been on the high ground in the past two months, above 56, reflecting robust growth in the sector.
    2. ANZ Job Advertisements: Monday, 1:30.
    3. NAB Business Confidence: Tuesday, 1:30.
    4. Chinese trade balance: Tuesday, 2:00. China is Australia’s No. 1 trade partner. A rise in China’s imports implies an increase in Australian exports. China enjoys a significant surplus. In Chinese yuan terms, the surplus is expected to slip from 294K to 292K. In US dollars, the surplus is predicted to widen from 42.8 billion to 45.3 billion.
    5. Christopher Kent talks: Tuesday, 22:35. Kent is the RBA Assistant Governor and he speaks in Sydney.
    6. Westpac Consumer Sentiment: Wednesday, 00:30. 
    7. Home Loans: Wednesday, 1:30. 
    8. Chinese inflation data: Wednesday, 1:30. Rises in Chinese prices imply growth, thus moving the Australian dollar. Producer prices were up 5.5% y/y in June are now expected to accelerate to 5.6%. Consumer prices are predicted to remain unchanged at 1.5%. Australian commodity prices are also reflected in producer prices.
    9. MI Inflation Expectations: Thursday, 1:00. 
    10. Philip Lowe talks: Thursday, 23:30. The Governor of the RBA makes an official testimony in Melbourne.
    AUD/USD Forecast August 7-11 2017 | Forex Crunch
    AUD/USD Forecast August 7-11 2017 | Forex Crunch
    • 2017.08.04
    • Yohay Elam
    • www.forexcrunch.com
    The Australian dollar struggled with the highs but did not give up on these levels, despite RBA pressure. Where next? The upcoming week features speeches from central bankers as well as important surveys. Here are the highlights of the week and an updated technical analysis for AUD/USD. Updates: AUD/USD daily graph with support and resistance...
     

    Weekly USD/CAD Outlook: 2017, August 06 - August 13 (based on the article)

    Dollar/CAD moved up, correction previous losses as oil prices cooled down. The upcoming week features housing figures from Canada. 


    1. Housing Starts: Tuesday, 12:15. The Canadian housing sector has been rocked by reports of house price falls in Toronto. A small slide to 206K is on the cards now.
    2. Building Permits: Wednesday, 12:30. A drop of 1.8% is forecast now.
    3. NHPI: Thursday, 12:30. The third housing indicator of the week relates to prices of new homes. A slightly more modest rise of 0.5% is projected.
    USD/CAD Forecast August 7-11 2017 | Forex Crunch
    USD/CAD Forecast August 7-11 2017 | Forex Crunch
    • 2017.08.04
    • Yohay Elam
    • www.forexcrunch.com
    Dollar/CAD moved up, correction previous losses as oil prices cooled down. The upcoming week features housing figures from Canada. Here are the highlights and an updated technical analysis for USD/CAD. Updates: USD/CAD daily graph with support and resistance lines on it. Click to enlarge: Housing Starts: Tuesday, 12:15. The Canadian housing...
     

    NZD/USD Intra-Day Fundamentals: New Zealand Inflation Expectations and range price movement 

    2017-08-07 04:00 GMT | [NZD - Inflation Expectations]

    • past data is 2.2%
    • forecast data is n/a
    • actual data is 2.1% according to the latest press release

    if actual > forecast (or previous one) = good for currency (for NZD in our case)

    [NZD - Inflation Expectations] = Percentage that business managers expect the price of goods and services to change annually during the next 2 years. 

    ==========

    From hotcopper article :

    • "The New Zealand dollar held near two-week lows on Monday while its Australian cousin steadied after four sessions of losses as the greenback finally found some favour from an upbeat U.S. jobs report. The New Zealand dollar NZD=D4 slipped 0.3 percent to $0.7395, just above last week's trough of $0.7392 - the lowest point since July 21."
    • "We think the RBNZ will do neither, though it is a risk." "An RBNZ survey on Monday showed inflation expectations for two years ahead had slipped to 2.09 percent, from 2.17 percent in the second quarter. The pullback adds to the case for keeping rates low for longer."
    • "Together with the low New Zealand Q2 CPI, the recent lift in the NZD raises the question of whether the RBNZ will talk down the NZD or replace its monetary policy's neutral bias with an easing bias," said Joseph Capurso, rates strategist at CBA.

    ==========

    NZD/USD M5: range price movement by New Zealand Inflation Expectations news event 

    New Zealand's central bank - Reserve Bank of New Zealand
    • www.rbnz.govt.nz
    The Reserve Bank of New Zealand manages monetary policy to maintain price stability, promotes the maintenance of a sound and efficient financial system, and supplies New Zealand banknotes and coins.
     

    USD/JPY Intra-Day FundamentalsJapan Adjusted Current Account and range price movement 

    2017-08-08 00:50 GMT | [JPY - Current Account]

    • past data is 1.40T
    • forecast data is 1.51T
    • actual data is 1.52T according to the latest press release

    if actual > forecast (or previous one) = good for currency (for JPY in our case)

    [JPY - Current Account] = Percentage that business managers expect the price of goods and services to change annually during the next 2 years. 

    ==========

    From rttnews article :

    • "Japan posted a current account surplus of 934.6 billion yen in June, the Ministry of Finance said on Tuesday."
    • "The adjusted current account showed a surplus of 1,522.5 billion yen versus expectations for 1,502.9 billion yen and up from 1,400.9 billion yen a month earlier. Also on Tuesday, the Bank of Japan said that overall bank lending in Japan was up 3.3 percent on year, coming in at 516.253 trillion yen. That was in line with expectations and unchanged from the June reading."

    ==========

    USD/JPY M5: range price movement by Japan Adjusted Current Account news event 

    Press Release (Press Release Date)
    Press Release (Press Release Date)
    • www.mof.go.jp
    Notice: As announced in "Revision of Balance of Payments Related Statistics in Japan" released on October 8, 2013, the Ministry of Finance and the Bank of Japan conducted an annual revision of balance of payments related statistics for data from January 2014 onward. In this context, the figures released in the following PDF file are...
    Reason: