Join our fan page

Lagrange polynomial - indicator for MetaTrader 4
- Views:
- 18353
- Rating:
- Published:
-
 You are missing trading opportunities:
- Free trading apps
- Over 8,000 signals for copying
- Economic news for exploring financial markets
Registration Log inYou agree to website policy and terms of use
If you do not have an account, please register -
 Need a robot or indicator based on this code? Order it on Freelance
Go to Freelance
Need a robot or indicator based on this code? Order it on Freelance
Go to Freelance
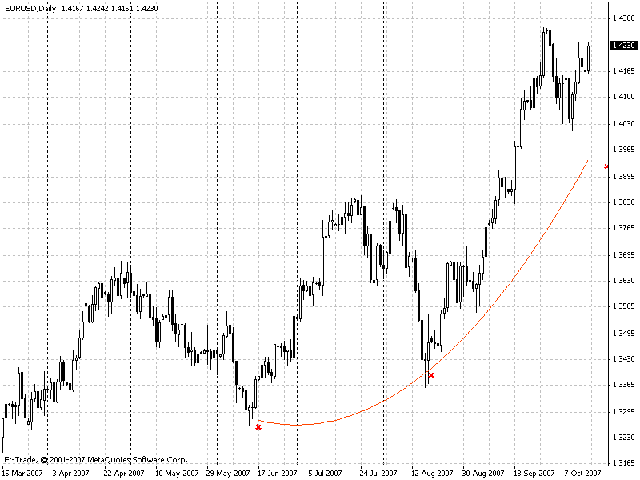
The first option is !siLagrange - automatically detects the maximums/minimums of the points and creates the polynomial on their basis
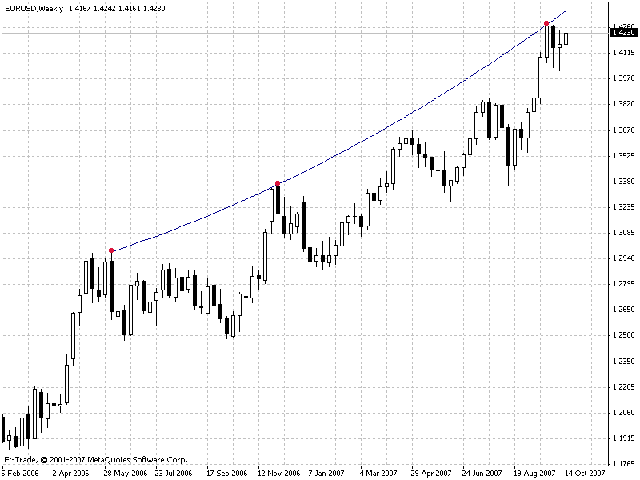
The second option is !siLagrangePnt - creates the polynomial based on the points specified by the user. The points are set using the "Arrow" tool.
Make sure their names match the parameter specified in the indicator. For more detailed help, see: https://www.mql5.com/ru/forum/105388
Translated from Russian by MetaQuotes Ltd.
Original code: https://www.mql5.com/ru/code/7488
camarilladt8
It is suitable for those who are too lazy to calculate the daily levels.
MultiTrend_Signal_KVN
The indicator of the famous trader Korykin. It helps to enter inside the channel.
Ticker Awesome Oscillator
It is calculated as the difference between two simple moving averages: SMA(5) and SMA(34). Type of the chart: histogram with green and red colored bars.
Ticker MACD
The chart contains the main line (the difference between the fast EMA and the slow EMA, applied to the Ticker line) and the signal line (obtained by applying the SMA to the main line).