Join our fan page
- Views:
- 4362
- Rating:
- Published:
-
Need a robot or indicator based on this code? Order it on Freelance Go to Freelance
Main Features
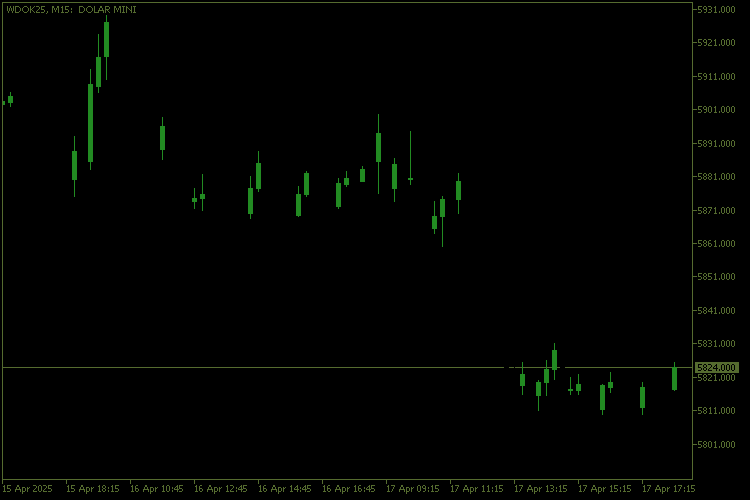
Candle filtering:The indicator allows you to display only those candles that meet a certain criterion:
- Bullish: Displays only bullish candles.
- Bearish: Displays only bearish candles.
- Doji: Displays only Doji candles.
- All: Displays all candles with their respective colours.
Doji candle detection:
The detection of Doji candles is based on a configurable threshold (`InpDojiThreshold`), which defines the ratio between the body of the candle and its total range. This guarantees accuracy in identifying neutral candles.
Candle filtering: Colour customisation:
The trader can define custom colours for each type of candle:
- Bullish: Default colour is green (`clrForestGreen`).
- Bearish: Default colour is dark red (`clrDarkRed`).
- Doji: Default colour is gold (`clrGold`).
- Bottom: Default colour is black (`clrBlack`).
Chart cleaning:
The indicator removes unnecessary visual elements from the chart, such as grids, volumes and period separators, to facilitate visual analysis.
How it works:
1. initialisation (`OnInit`):
Buffers are mapped to store OHLC values (open, high, low, close) and the corresponding colours.
Custom colours are assigned to the indicator's colour indices.
The chart is cleaned up by removing unnecessary visual elements.
2. Main Calculation (`OnCalculate`)
For each candle on the chart, the indicator checks whether it meets the selected criterion (`InpCandleShow`).
Candles that do not meet the criterion are displayed in background colour (`InpBackgroundColor`).
Candles that meet the criterion are displayed with custom colours.
3. Deinitialisation (`OnDeinit`):
When the indicator is removed, the original chart settings are restored, ensuring that the trading environment returns to its initial state.
Usage examples:
- Trend Analysis:
Set `InpCandleShow` to `ShowBullish` or `ShowBearish` to focus only on candles that indicate an uptrend or downtrend.
-
Identifying Neutral Zones:
Use `ShowDoji` to highlight neutral candles and identify possible reversal or consolidation points.
- Full Visualisation:
Choose `ShowAllCandle` to display all candles with their respective colours, allowing an overview of market behaviour.
Improvements Implemented:
- Accurate Doji Detection: The use of a configurable threshold (`InpDojiThreshold`) ensures that only truly neutral candles are classified as Doji.
- Full Customisation: The trader has complete control over the colours and background of the chart.
- Automatic Cleaning: The indicator automatically removes unnecessary visual elements, improving the readability of the chart.

Translated from Portuguese by MetaQuotes Ltd.
Original code: https://www.mql5.com/pt/code/58516
 Basket Manager EA
This EA is meant to impose a few rules to manage baskets.
 RSI Divergence
This indicator takes RSI divergences and plots them in buffers to automate EAs
 Function for checking whether the market is open for trading at the moment by the current symbol
The function can be useful to not overload the server with trade requests at times when the market is closed for trading
 Equity and Balance Indicator - History based
This indicator reads the trade history and plots the Cumulative P & L over time, helping visual traders to see how much money they are making or losing over time. This current version has a difference of 0.02% marginal error, due to rounding floats, and calculation methods. It can be considered extremely precise with this marginal error.