Join our fan page
- Views:
- 3712
- Rating:
- Published:
-
Need a robot or indicator based on this code? Order it on Freelance Go to Freelance
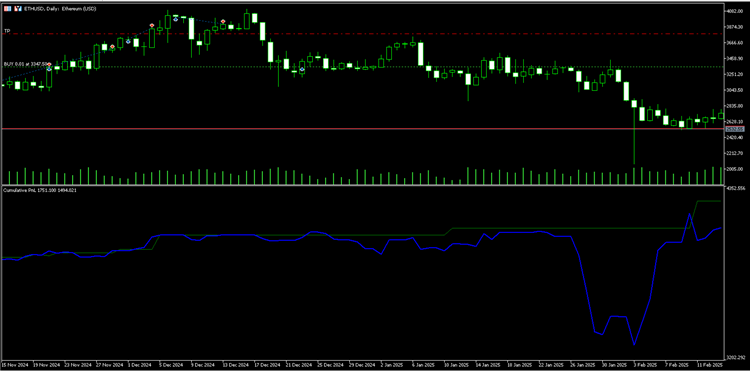
Cumulative P&L Indicator

OVERVIEW
 Function for checking whether the market is open for trading at the moment by the current symbol
The function can be useful to not overload the server with trade requests at times when the market is closed for trading
 Candle Filter
The Candle Filter indicator is a customisable tool designed to filter and highlight candles on the chart based on specific criteria. It allows the trader to visualise only the candles of interest, such as bullish candles, bearish candles, Doji candles or all candles simultaneously. In addition, the indicator offers full control over the colours of the candles and the chart background, providing a clear and adaptable visual experience.
 Trendline zigzag in qualitative channel
A dynamic trendline-based evolution of the Donchian Channel
 Engulfing Pattern Indicator with Volume Confirmation
This indicator detects bullish and bearish engulfing candlestick patterns with an optional volume filter to highlight stronger signals.