Join our fan page

Better volume - indicator for MetaTrader 5

- Views:
- 13257
- Rating:
- Published:
-
 You are missing trading opportunities:
- Free trading apps
- Over 8,000 signals for copying
- Economic news for exploring financial markets
Registration Log inYou agree to website policy and terms of use
If you do not have an account, please register -
 Need a robot or indicator based on this code? Order it on Freelance
Go to Freelance
Need a robot or indicator based on this code? Order it on Freelance
Go to Freelance
Main Features
-
Dynamic Volume Categorisation :
- The indicator classifies volume into various categories, assigning different colours to facilitate visual interpretation:
- Buying Climax ( clrCrimson ): Identifies moments when volume is extremely high and the price is rising.
- Selling Climax ( clrLimeGreen ): Signals moments of strong selling pressure with high volume.
- Churn ( clrGold ): Detects high volatility without a clear price direction.
- Climax Churn ( clrMagenta ): Combines buy/sell climax with churn, indicating extreme volatility.
- Weak Candle ( clrDarkTurquoise ): Identifies candles with minimal volume in the lookback window.
- Volume Balance ( clrWhiteSmoke ): Represents standard volume, with no specific characteristics that classify it in other categories. This colour is used as a "base colour" when none of the above patterns are detected.
- The indicator classifies volume into various categories, assigning different colours to facilitate visual interpretation:
-
Moving Average Volume :
- A smoothed moving average line ( clrMaroon ) is displayed to help identify trends in volume over time.
-
Advanced Customisation :
- Moving Average Period : Adjust the moving average period to adapt the indicator to your trading style.
- Lookback Window : Set up the lookback window to compare the current volume with recent values.
- Volume Type : Choose between real volume ( VOLUME_REAL ) or tick volume ( VOLUME_TICK ) to suit the characteristics of the asset being analysed.
-
Clear visual interface :
- A coloured histogram ( DRAW_COLOR_HISTOGRAM ) displays the volume categories in an intuitive way, allowing for quick and efficient analysis.
-
Flexibility for Different Timeframes :
- The indicator works on any timeframe, from intraday charts to weekly or monthly charts.
How to interpret the signals
- Buy/Sell Climax : Indicates moments of strong accumulation or distribution, suggesting possible trend reversals or continuations.
- Churn : Signalling high volatility without a clear direction, indicating uncertainty in the market.
- Weak Candles : Shows moments of low activity in the market, often associated with consolidations or periods of indecision.
- Volume Balance : Represents normal market behaviour, without significant anomalies. It is useful for identifying areas of stability.
Configuration and Use
Better Volume is easy to set up and use:
- Add the indicator to your chart in MetaTrader 5.
- Adjust the parameters as necessary:
- Moving Average Period : Sets the smoothness of the moving average line.
- Lookback Window : Determines the number of candles used for comparisons.
- Volume Type : Choose between real volume or tick volume.
- Observe the signals generated by the histogram and the moving average line to make informed decisions.
Why Use Better Volume?
- Volume Flow Analysis : Better understand the behaviour of market participants based on volume.
- Pattern Identification : Detect buy/sell climaxes, churn and other important patterns that can influence your trading decisions.
- Ease of Use : The intuitive visual interface and customisation options make the indicator accessible to both beginners and experienced traders.
Application example
- Use the indicator to confirm entry/exit signals in volume-based strategies.
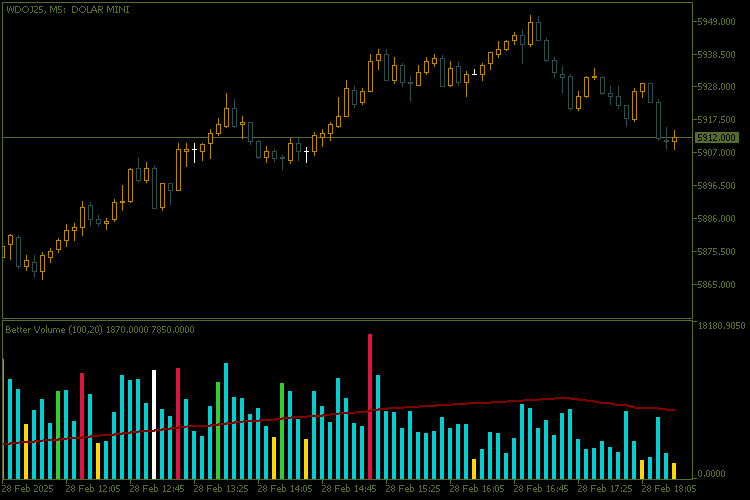
https://www.mql5.com/en/charts/20770866/wdoj25-m5-banco-btg-pactual
Translated from Portuguese by MetaQuotes Ltd.
Original code: https://www.mql5.com/pt/code/56678
 RiskManager with InfoPanel and Support
My first code on the site, which requires improvement. The idea to create an ideal tool for traders, in the work on the main component of any trading system-Risk Manager
 Panel for Calculating History Profit
This CalculateHistoryProfit script version 1.0 is designed to calculate profit for a specified period using a chart panel.
AveragePrice
Indicator for calculating the average price of open positions, you can use the magic number if you want to separate the positions of just one robot, but the zero number is for manual operations.
Spreads
Two Symbol Spread Indicator